这篇“R语言怎么使用gganimate创建可视化动图”文章的知识点大部分人都不太理解,所以小编给大家总结了以下内容,内容详细,步骤清晰,具有一定的借鉴价值,希望大家阅读完这篇文章能有所收获,下面我们一起来看看这篇“R语言怎么使用gganim
这篇“R语言怎么使用gganimate创建可视化动图”文章的知识点大部分人都不太理解,所以小编给大家总结了以下内容,内容详细,步骤清晰,具有一定的借鉴价值,希望大家阅读完这篇文章能有所收获,下面我们一起来看看这篇“R语言怎么使用gganimate创建可视化动图”文章吧。
#R包安装install.packages("devtools")library(devtools) install_GitHub("thomasp85/gganimate")install.packages("gapminder")#加载library(gganimate)library(gapminder)#查看数据head(gapminder)# A tibble: 6 x 6 country continent year lifeExp pop gdpPercap <fct> <fct> <int> <dbl> <int> <dbl>1 Afghanistan Asia 1952 28.8 8425333 779.2 Afghanistan Asia 1957 30.3 9240934 821.3 Afghanistan Asia 1962 32.0 10267083 853.4 Afghanistan Asia 1967 34.0 11537966 836.5 Afghanistan Asia 1972 36.1 13079460 740.6 Afghanistan Asia 1977 38.4 14880372 786.数据集包括全球主要国家在1952-2007年的人均GDP增长、预期寿命以及人口增长的数据 。
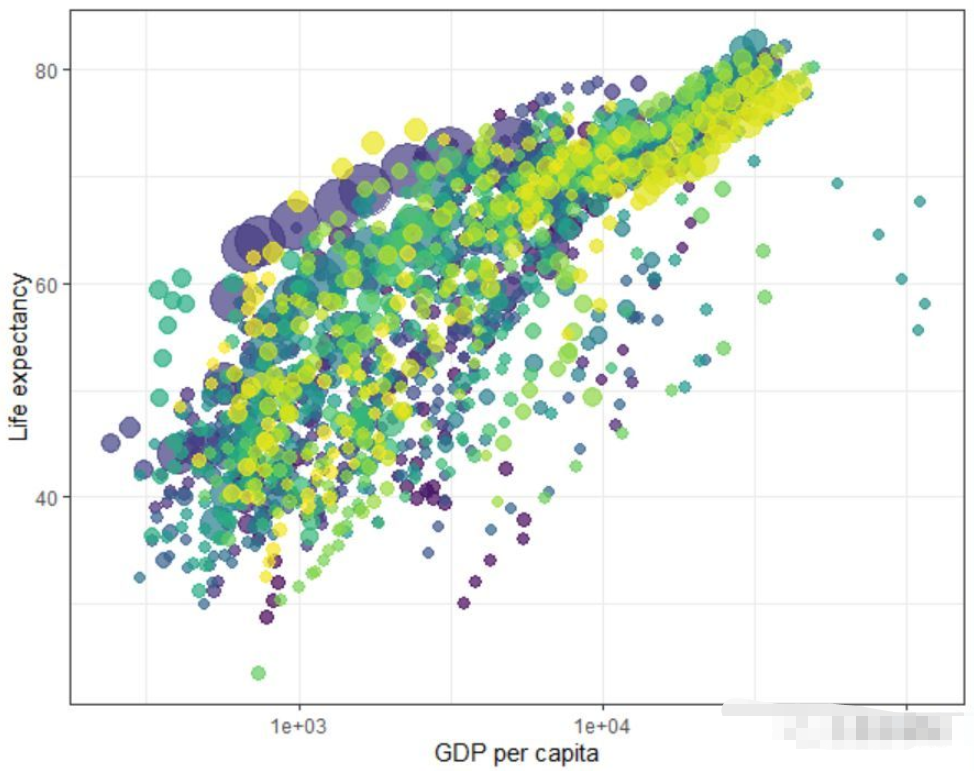
使用ggplot2绘制
theme_set(theme_bw())p <- ggplot(gapminder, aes(x = gdpPercap, y=lifeExp, size = pop, colour = country)) + geom_point(show.legend = FALSE, alpha = 0.7) + scale_color_viridis_d() + scale_size(range = c(2, 12)) + scale_x_log10() + labs(x = "GDP per capita", y = "Life expectancy")p
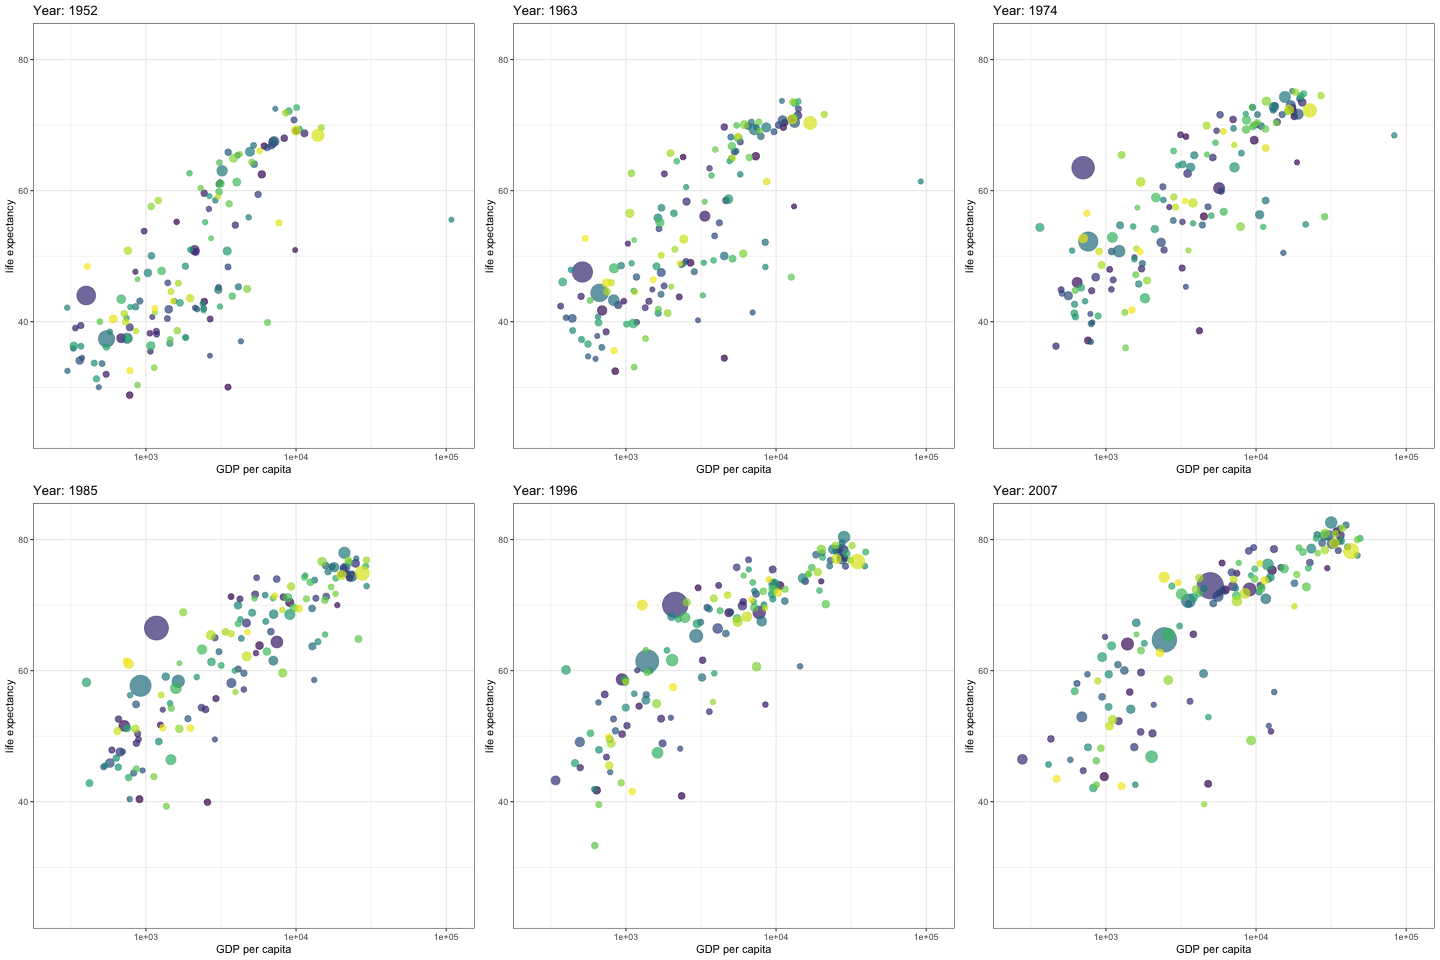
transition_time() 核心函数,添加动态
p + transition_time(year) + labs(title = "Year: {frame_time}")
2 按需设置
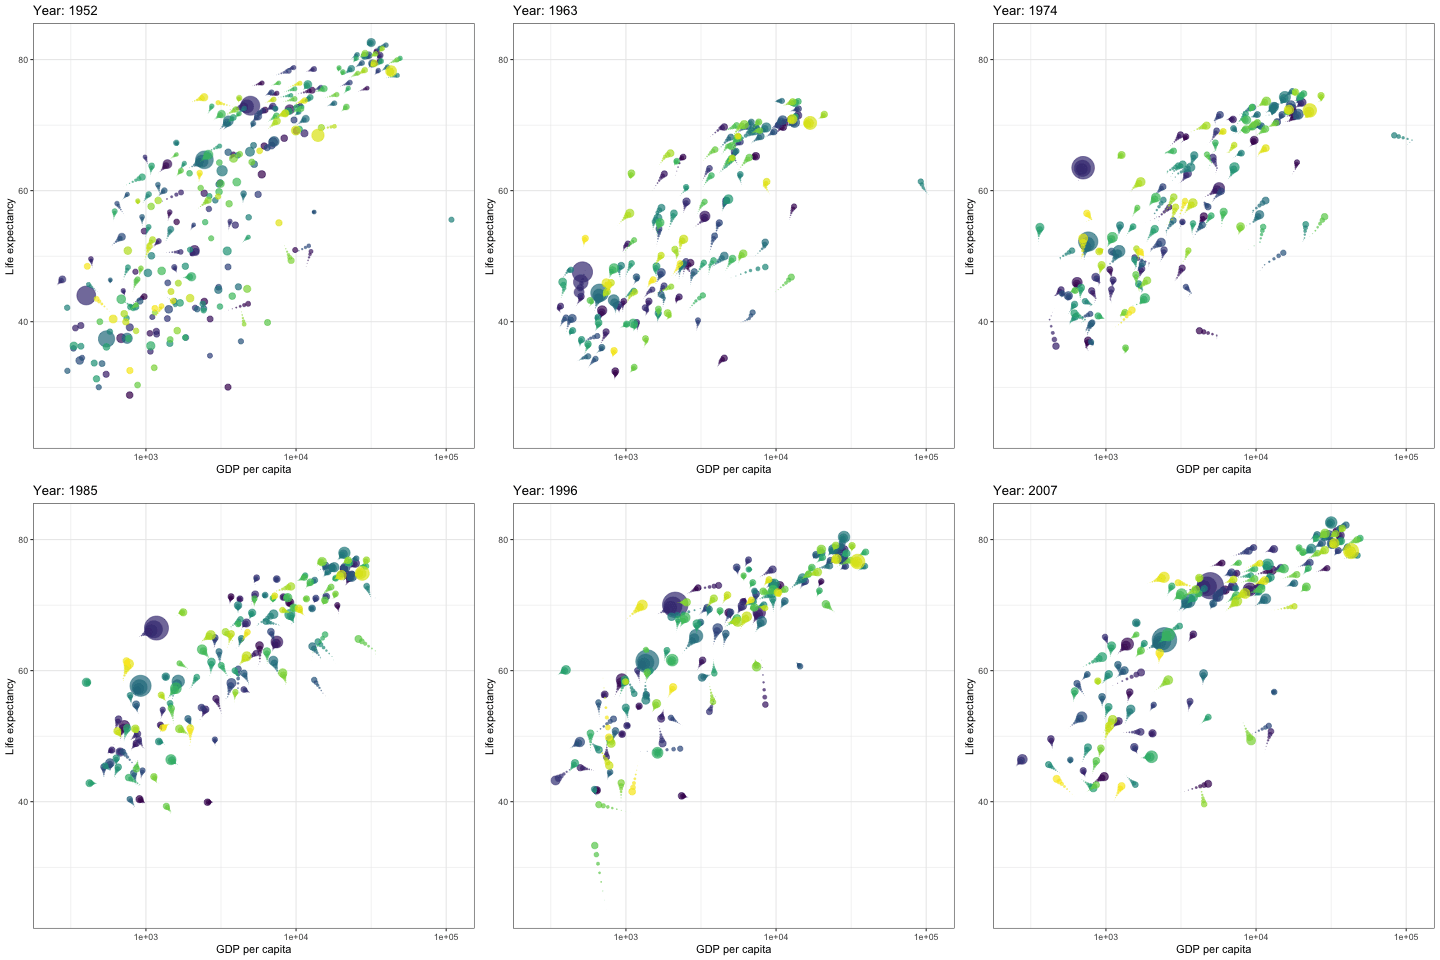
1)添加小尾巴
p + transition_time(year) + labs(title = "Year: {frame_time}") + shadow_wake(wake_length = 0.1, alpha = FALSE)
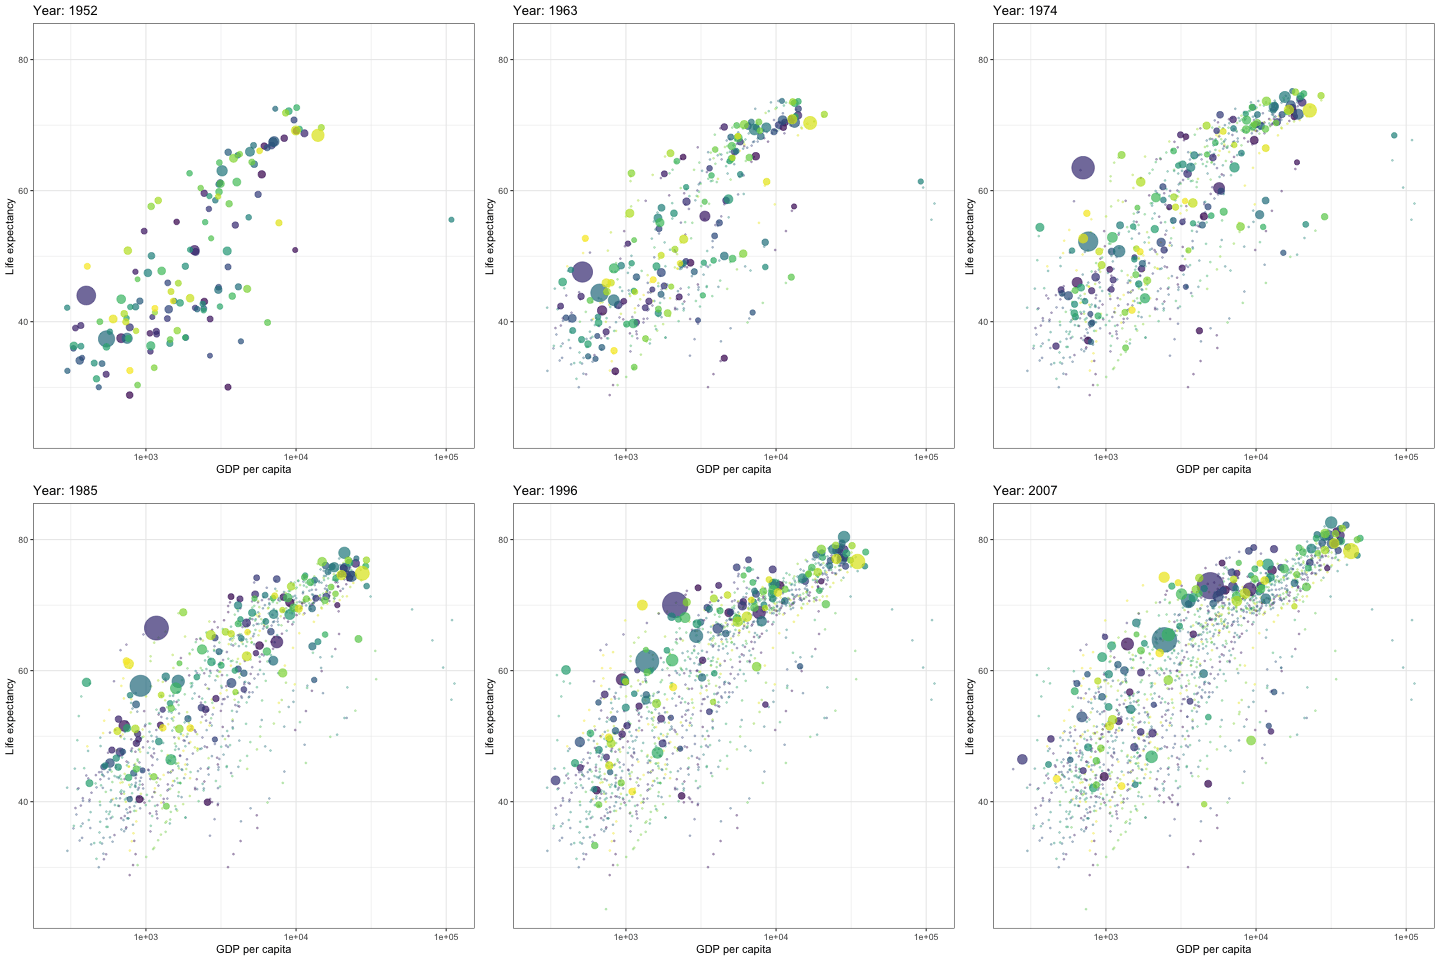
2)原数据做背景
p + transition_time(year) + labs(title = "Year: {frame_time}") + shadow_mark(alpha = 0.3, size = 0.5)
以上就是关于“R语言怎么使用gganimate创建可视化动图”这篇文章的内容,相信大家都有了一定的了解,希望小编分享的内容对大家有帮助,若想了解更多相关的知识内容,请关注编程网精选频道。
--结束END--
本文标题: R语言怎么使用gganimate创建可视化动图
本文链接: https://lsjlt.com/news/329226.html(转载时请注明来源链接)
有问题或投稿请发送至: 邮箱/279061341@qq.com QQ/279061341
2024-05-24
2024-05-24
2024-05-24
2024-05-24
2024-05-24
2024-05-24
2024-05-24
2024-05-24
2024-05-24
2024-05-24
回答
回答
回答
回答
回答
回答
回答
回答
回答
回答
0