Python 官方文档:入门教程 => 点击学习
python中使用matplotlib模块的add_subplot函数添加子图,具体方法如下:from matplotlib import pyplot as plt #导入matplotlib模块fig = plt.figure()ax1

python中使用matplotlib模块的add_subplot函数添加子图,具体方法如下:
from matplotlib import pyplot as plt #导入matplotlib模块
fig = plt.figure()
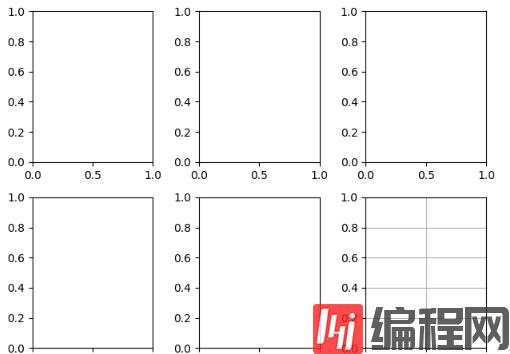
ax1 = fig.add_subplot(231)
ax2 = fig.add_subplot(232)
ax3 = fig.add_subplot(233)
ax4 = fig.add_subplot(234)
ax5 = fig.add_subplot(235)
ax6 = fig.add_subplot(236)
plt.grid(True)
plt.show()
效果图:

--结束END--
本文标题: python添加子图使用什么函数
本文链接: https://lsjlt.com/news/114774.html(转载时请注明来源链接)
有问题或投稿请发送至: 邮箱/279061341@qq.com QQ/279061341
2024-03-01
2024-03-01
2024-03-01
2024-02-29
2024-02-29
2024-02-29
2024-02-29
2024-02-29
2024-02-29
2024-02-29
回答
回答
回答
回答
回答
回答
回答
回答
回答
回答
0