db file scattered read 一: db file scattered read 说明 二: db file scattered read 解决思路 三:
db file scattered read
一: db file scattered read 说明
二: db file scattered read 解决思路
三: db file scattered read 重现过程
四: db file scattered read 官方文档
一: db file scattered read 说明
oracle在执行全表扫描(
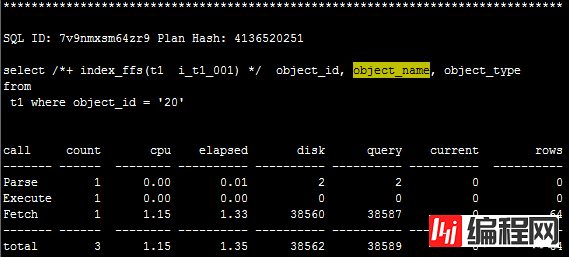
Full Table Scan,FTS)、索引快速全扫描(
Index Fast Full Scan)时,为保障性能,尽量一次性读取多个块,这称为
Multi Block I/O。
每次执行Multi Block I/O,都会等待物理I/O结束,此时等待
db file scattered read事件。
https://docs.oracle.com/cd/E11882_01/server.112/e41573/instance_tune.htm#PFGRF94479
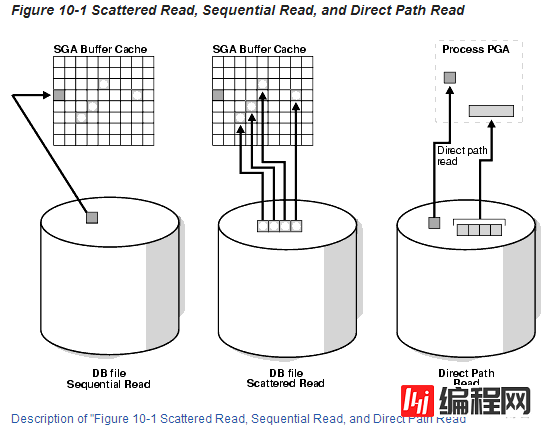
This event signifies that the user process is reading buffers into the SGA buffer cache and is waiting for a physical I/O call to return. A db file scattered read issues a scattered read to read the data into multiple discontinuous memory locations. A scattered read is usually a multiblock read. It can occur for a fast full scan (of an index) in addition to a full table scan.
The db file scattered read wait event identifies that a full scan is occurring. When perfORMing a full scan into the buffer cache, the blocks read are read into memory locations that are not physically adjacent to each other. Such reads are called scattered read calls, because the blocks are scattered throughout memory. This is why the corresponding wait event is called 'db file scattered read'. multiblock (up to DB_FILE_MULTIBLOCK_READ_COUNT blocks) reads due to full scans into the buffer cache show up as waits for 'db file scattered read'.
https://docs.oracle.com/cd/E11882_01/server.112/e40402/waitevents003.htm#BGGIBDJI
Similar to db file sequential read, except that the session is reading multiple data blocks.
二:
db file scattered read
解决思路
1 SQL优化
如果是某些sql引起的,例如统计信息不准确,没有索引或使用低效的索引等,可以通过优化SQL,降低db file scattered read;
2 分区表
可以考虑将全表扫描优化成分区扫描;
3 增大BUFFER CACHE
如果db file scattered read出现特别频繁,Buffer HIT较低,可以考虑增大buffer cache;
4 使用更快的存储;
select name, parameter1, parameter2, parameter3
from v$event_name
where name = 'db file scattered read';

---查看含有db file scattered read等待事件的session;
SELECT sid, total_waits, time_waited
FROM v$session_event
WHERE event = 'db file scattered read'
and total_waits > 0
ORDER BY 2 desc;

select sid, event, p1, p2, p3, wait_class
from v$session_wait
where event = 'db file scattered read';

Check the following V$SESSION_WAIT parameter columns:
P1: The absolute file number
P2: The block being read
P3: The number of blocks (should be greater than 1)
select owner, segment_name, segment_type
from dba_extents
where file_id = 6
and 37475 between block_id and block_id + blocks - 1;

SELECT row_wait_obj# FROM V$SESSION WHERE EVENT = 'db file scattered read';

SELECT owner, object_name, subobject_name, object_type
FROM DBA_OBJECTS
WHERE data_object_id = '88605';

select v.last_call_et,
v.username,
v.sid,
sql.sql_text,
sql.sql_id,
sql.disk_reads,
v.event
from v$session v, v$sql sql
where v.sql_address = sql.address
and v.last_call_et > 0
and v.status = 'ACTIVE'
and v.username is not null;

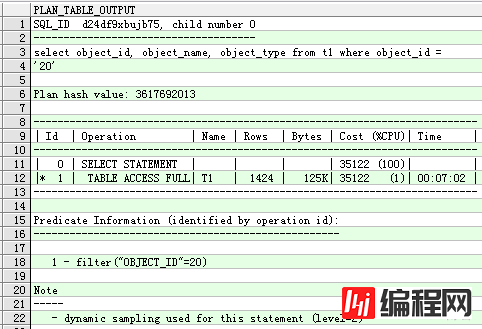
select * from table(dbms_xplan.display_cursor('d24df9xbujb75'));
---SELECT SQL_ADDRESS, SQL_HASH_VALUE
FROM V$SESSION
WHERE EVENT LIKE 'db file%read';
三: db file scattered read 重现过程
索引
快速
全扫描(Index Fast Full Scan)
SQL> create tablespace chenjch_tbs datafile '/u01/app/oracle/oradata/orcl/chenjch_tbs01a.dbf' size 10M autoextend on maxsize 1G;
SQL> create user chenjch identified by a default tablespace chenjch_tbs;
SQL> grant connect,resource,dba to chenjch;
SQL> create table t1 as select * from dba_objects;
SQL> insert into t1 select * from t1;
SQL> commit;
SQL> insert into t1 select * from t1;
SQL> commit;
SQL> insert into t1 select * from t1;
SQL> commit;
......
SQL> create index i_t1_001 on t1(object_id,object_name,object_type);
SQL>
begin
dbms_workload_repository.create_snapshot();
end;
SQL> alter system flush buffer_cache;
SQL> alter session set tracefile_identifier='10046';
SQL> alter session set events '10046 trace name context forever, level 12';
SQL> select object_id, object_name, object_type from t1 where object_id = '20';
SQL> alter session set events '10046 trace name context off';
SQL>
begin
dbms_workload_repository.create_snapshot();
end;
SQL>
select distinct (m.sid), p.pid, p.tracefile
from v$mystat m, v$session s, v$process p
where m.sid = s.sid
and s.paddr = p.addr;
---/u01/app/oracle/diag/rdbms/orcl/orcl/trace/orcl_ora_57032_10046.trc
[oracle@dip ~]$ tkprof /u01/app/oracle/diag/rdbms/orcl/orcl/trace/orcl_ora_57032_10046.trc /home/oracle/10046_3.trc


全表扫描(Full Table Scan,FTS)
http://f.dataguru.cn/thread-44033-1-1.html
Oracle 11g,在大表的全表扫描 算法上有新的变化,根据表的大小、高速缓存的大小等信息,决定是否绕过SGA直接从磁盘读取数据。
而10g则是全部通过高速缓存读取数据。
Oracle 11g认为大表全表时使用直接路径读,可能比10g中的数据文件散列读(db file scattered reads)速度更快,效率更高,因此我们看到的大部分为
direct path read等待事件。
Oracle 11g提供我们选择权,这个选择权可以通过隐含参数来控制,就是"
_serial_direct_read",此参数默认值为auto
SQL> create tablespace chenjch_tbs datafile '/u01/app/oracle/oradata/orcl/chenjch_tbs01a.dbf' size 10M autoextend on maxsize 1G;
SQL> create user chenjch identified by a default tablespace chenjch_tbs;
SQL> grant connect,resource,dba to chenjch;
SQL> create table t1 as select * from dba_objects;
SQL> insert into t1 select * from t1;
SQL> commit;
SQL> insert into t1 select * from t1;
SQL> commit;
SQL> insert into t1 select * from t1;
SQL> commit;
......
SQL>
begin
dbms_workload_repository.create_snapshot();
end;
SQL> alter system flush buffer_cache;
SQL> alter session set tracefile_identifier='10046';
SQL> alter session set events '10046 trace name context forever, level 12';
SQL> select object_id, object_name, object_type from t1 where object_id = '20';
SQL> alter session set events '10046 trace name context off';
SQL>
begin
dbms_workload_repository.create_snapshot();
end;
SQL>
select distinct (m.sid), p.pid, p.tracefile
from v$mystat m, v$session s, v$process p
where m.sid = s.sid
and s.paddr = p.addr;
---/u01/app/oracle/diag/rdbms/orcl/orcl/trace/orcl_ora_55600_10046.trc
[oracle@dip ~]$ cp /u01/app/oracle/diag/rdbms/orcl/orcl/trace/orcl_ora_55600_10046.trc .
[oracle@dip ~]$ tkprof orcl_ora_55600_10046.trc 10046_1.trc
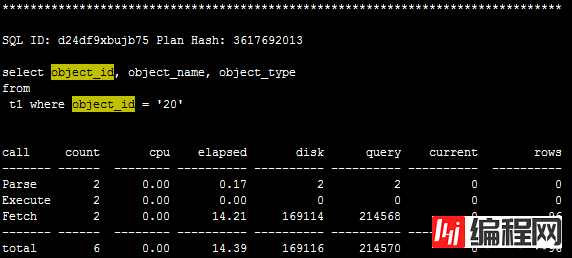


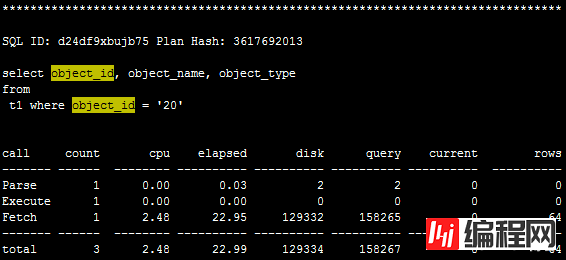
关闭 direct path read 特效,全表扫描时等待事件变成 db file scattered read
SQL>
select a.ksppinm name, b.ksppstvl value, a.ksppdesc description
from x$ksppi a, x$ksppcv b
where a.indx = b.indx
and a.ksppinm like '_serial_direct_read'; ---auto
SQL> alter session set "_serial_direct_read"=never;
SQL>
begin
dbms_workload_repository.create_snapshot();
end;
SQL> alter system flush buffer_cache;
SQL> alter session set tracefile_identifier='10046';
SQL> alter session set events '10046 trace name context forever, level 12';
SQL> select object_id, object_name, object_type from t1 where object_id = '20';
SQL> alter session set events '10046 trace name context off';
SQL>
begin
dbms_workload_repository.create_snapshot();
end;
SQL>
select distinct (m.sid), p.pid, p.tracefile
from v$mystat m, v$session s, v$process p
where m.sid = s.sid
and s.paddr = p.addr;
---/u01/app/oracle/diag/rdbms/orcl/orcl/trace/orcl_ora_55600_10046.trc
[oracle@dip ~]$ cp /u01/app/oracle/diag/rdbms/orcl/orcl/trace/orcl_ora_55600_10046.trc 10046_2.trc
[oracle@dip ~]$ tkprof 10046_2.trc 10046_2a.trc


四: db file scattered read 官方文档
https://docs.oracle.com/cd/E11882_01/server.112/e40402/waitevents003.htm#BGGIBDJI
Similar to db file sequential read, except that the session is reading multiple data blocks.
Wait Time: The wait time is the actual time it takes to do all of the I/Os

https://docs.oracle.com/cd/E11882_01/server.112/e41573/instance_tune.htm#PFGRF94479
This event signifies that the user process is reading buffers into the SGA buffer cache and is waiting for a physical I/O call to return. A db file scattered read issues a scattered read to read the data into multiple discontinuous memory locations. A scattered read is usually a multiblock read. It can occur for a fast full scan (of an index) in addition to a full table scan.
The db file scattered read wait event identifies that a full scan is occurring. When performing a full scan into the buffer cache, the blocks read are read into memory locations that are not physically adjacent to each other. Such reads are called scattered read calls, because the blocks are scattered throughout memory. This is why the corresponding wait event is called 'db file scattered read'. multiblock (up to DB_FILE_MULTIBLOCK_READ_COUNT blocks) reads due to full scans into the buffer cache show up as waits for 'db file scattered read'.
Check the following V$SESSION_WAIT parameter columns:
P1: The absolute file number
P2: The block being read
P3: The number of blocks (should be greater than 1)
There are several ways to handle excessive I/O waits. In the order of effectiveness, these are as follows:
Reduce the I/O activity by SQL tuning.
Reduce the need to do I/O by managing the workload.
Gather system statistics with DBMS_STATS package, allowing the query optimizer to accurately cost possible access paths that use full scans.
Use Automatic Storage Management.
Add more disks to reduce the number of I/Os for each disk.
Alleviate I/O hot spots by Redistributing I/O across existing disks.
The first course of action should be to find opportunities to reduce I/O. Examine the SQL statements being run by sessions waiting for these events and statements causing high physical I/Os from V$SQLAREA. Factors that can adversely affect the execution plans causing excessive I/O include the following:
Improperly optimized SQL
Missing indexes
High degree of parallelism for the table (skewing the optimizer toward scans)
Lack of accurate statistics for the optimizer
Setting the value for DB_FILE_MULTIBLOCK_READ_COUNT initialization parameter too high which favors full scans
Besides reducing I/O, also examine the I/O distribution of files across the disks. Is I/O distributed uniformly across the disks, or are there hot spots on some disks? Are the number of disks sufficient to meet the I/O needs of the database?
See the total I/O operations (reads and writes) by the database, and compare those with the number of disks used. Remember to include the I/O activity of LGWR and ARCH processes.
Use the following query to determine, at a point in time, which sessions are waiting for I/O:
SELECT SQL_ADDRESS, SQL_HASH_VALUE
FROM V$SESSION
WHERE EVENT LIKE 'db file%read';
To determine the possible causes, first query V$SESSION to identify the value of ROW_WAIT_OBJ# when the session waits for db file scatteredread. For example:
SELECT row_wait_obj#
FROM V$SESSION
WHERE EVENT = 'db file scattered read';
To identify the object and object type contended for, query DBA_OBJECTS using the value for ROW_WAIT_OBJ# that is returned from V$SESSION. For example:
SELECT owner, object_name, subobject_name, object_type
FROM DBA_OBJECTS
WHERE data_object_id = &row_wait_obj;
https://support.oracle.com/epmos/faces/DocContentDisplay?_afrLoop=162624307195503&id=34558.1&_afrWindowMode=0&_adf.ctrl-state=1a6zu7mmvj_153
WAITEVENT: "db file scattered read" Reference Note (文档 ID 34558.1)
|
--结束END-- 本文标题: db file scattered read 本文链接: https://lsjlt.com/news/46590.html(转载时请注明来源链接) 有问题或投稿请发送至: 邮箱/279061341@qq.com QQ/279061341
猜你喜欢
热门wiki
近期文章
推荐阅读
热门问答
热门标签
|
0