Python 官方文档:入门教程 => 点击学习
【python与数学建模】蒙特卡洛模拟&仿真 零、前言引例:投针实验试验描述:试验分析:代码实现 蒙特卡洛模拟&仿真的基本介绍应用实例实例一、三门问题问题描述问题分析与代码实现 实例
在之前一篇文章中,我们已经通过 MATLAB 实现了蒙特卡洛模拟,这篇文章将用 Python 将其中的案例重新实现。

如图所示, Q Q Q 为针的中点, x x x 为中点 Q Q Q 到最近一条平行线的距离, θ \theta θ 为针与这条平行线的夹角,则显然有如下关系: 0≤x≤ a 2 ,0≤θ≤π 0 \leq x \leq \frac{a}{2}, 0 \leq \theta \leq \pi 0≤x≤2a,0≤θ≤π
而如果针与直线相交,则满足: x≤ L 2 sinθ x \leq \frac{L}{2} sin\theta x≤2Lsinθ
图示为:
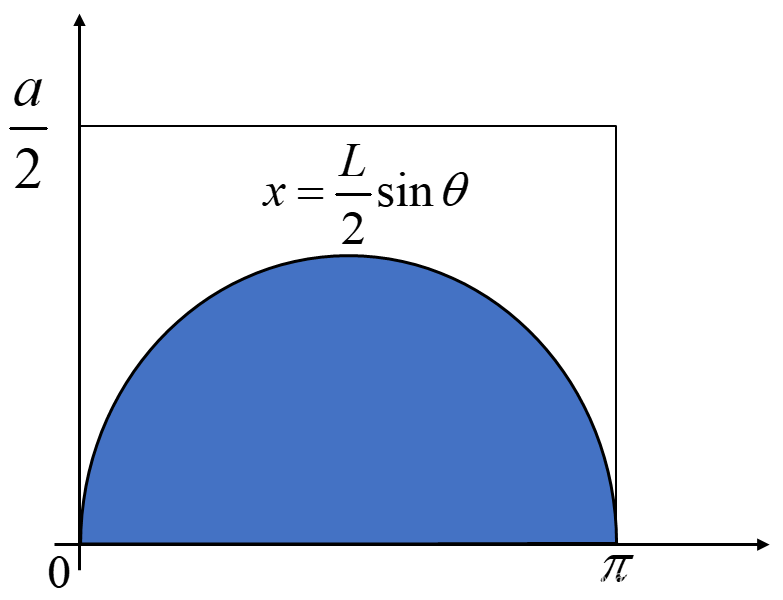
根据以上关系,经过证明可得针与直线相交的概率即为蓝色区域面积与矩形面积的比值,经过积分计算得到: p= 2 L π a p=\frac{2L}{\pi a} p=πa2L即: π= 2 L a p \pi = \frac{2L}{ap} π=ap2L由此我们可以用投针试验来估计 π \pi π 的值:
from numpy import random as rdfrom numpy import pi, sinL = 1 # 设置针的长度a = 2 # 设置平行线之间的距离n = 100000 # 设置单次模拟次数,次数越多,结果越准确N = 1000 # 设置总模拟次数x = rd.random(n)*a/2 # 在0到a/2上均匀取n个数,表示针的中点与最近平行线的距离Angle = rd.random(n)*pi # 在0到pi上均匀取n个数,表示针与最近平行线的夹角result = [] # 初始化空列表,用来存储每次总模拟的结果for j in range(N): m = 0 # 记录针与平行线相交的次数 p = 0 for i in range(n): if x[i] <= L/2 * sin(Angle[i]): # 判断针与线是否相交 m += 1 p = m/n Single_Cal_PI = (2*L)/(a*p) # 估计pi值 result.append(Single_Cal_PI) # 存储进result中Cal_PI = np.mean(result) # 求均值print('经过模拟得到的PI值为:%.8f' % Cal_PI)输出结果:

蒙特卡罗模拟是一种随机模拟方法,如果我们所求解的问题与概率模型存在一定的关系,我们便可以借助计算机多次模拟事件的发生,以获得问题的近似解。
蒙特卡罗模拟不能说是一种方法,而是一种思想,因此针对不同的问题我们要设计不同的代码。
你参加了一个电视节目,面前有三道门,其中一扇门后有一个大奖,此时你选择了 B 门,若此时主持人打开 C 门,发现为空,问你是否要更换为 A门?
from numpy import random as rdimport matplotlib.pyplot as pltimport warningswarnings.filterwarnings('ignore')plt.rcParams["font.sans-serif"] = ["SimHei"]plt.rcParams["axes.unicode_minus"] = FalseN = 10000 # 模拟次数Ch = 0 # 改变选择赢的次数NoCh = 0 # 不改变选择赢的次数for i in range(N): x = rd.randint(1, 4) # 从区间[1,4)中取一个整数,表示礼物所在的门号 y = rd.randint(1, 4) # 表示初始选择的门号 if x==y: NoCh += 1 else: Ch += 1print("""共模拟 %d 次其中改变选择后赢的次数为:Ch=%d不改变选择后赢的次数为:Noch=%d""" % (N, Ch, NoCh))plt.figure()plt.barh('改变选择', Ch)plt.barh('不改变选择', NoCh)plt.title('两种抉择后赢的次数')plt.show()结果:


可以明显地看到,改变选择后赢的次数远远大于不改变的,实际上,改变后赢的可能性为不改变的 2 倍。
只有一个港口可供卸货,每两艘船到达港口的时间间隔为 15 分钟到 145 分钟,轮船卸货时间取决于货物量,时间长为 45 分钟到 90 分钟。
通过模拟仿真,回答如下问题:
每艘船在港口呆的平均时间;
每艘船等待的平均时间;
港口的空闲时间比例;
假设以1分钟为最小计时单位。
假设到达服从一致分布(可以根据不同情况调整到达时间的分布)
代码实现:
import numpy as npfrom numpy import random as rdimport matplotlib.pyplot as pltimport warningswarnings.filterwarnings('ignore')# 解决图片的中文乱码问题plt.rcParams["font.sans-serif"] = ["SimHei"]plt.rcParams["axes.unicode_minus"] = FalseN = 5 # 设置船只数Between = rd.randint(15, 146, N) # 生成整数均匀分布的到达时间间隔Unload = rd.randint(45, 91, N) # 卸货时间间隔Arrive = np.cumsum(Between) # 计算船只到达时间点Start = np.zeros(N, dtype=int) # 初始化各船开始卸货时间点Idle = np.zeros(N, dtype=int) # 初始化港口空闲时间长度Wait = np.zeros(N, dtype=int) # 初始化各船等待时间长度Finish = np.zeros(N, dtype=int) # 初始化各船卸货完毕时间点Total = np.zeros(N, dtype=int) # 初始化各船在港口的总用时长度Idle[0] = Arrive[0] # 第一艘船未到达时间为港口空闲时间Wait[0] = 0 # 第一艘船不需要等待Start[0] = Arrive[0] + Wait[0] # 第一艘船开始卸货时间Finish[0] = Start[0] + Unload[0] # 第一艘船结束卸货时间Total[0] = Finish[0] - Arrive[0] # 第一艘船在港口的总时间Ship_Num = [i for i in range(1, 6)] # 船只编号for ind in range(1, N): # 对剩下的船只进行模拟 Idle[ind] = max(0, Arrive[ind]-Finish[ind-1]) # 第ind艘船到达前的空闲时间,要大于等于0 Wait[ind] = max(0, Finish[ind-1]-Arrive[ind]) # 第ind艘船到达后的等待时间,要大于等于0 Start[ind] = Arrive[ind] + Wait[ind] # 第ind艘船开始卸货的时间 Finish[ind] = Start[ind] + Unload[ind] # 第ind艘船完成卸货的时间 Total[ind] = Finish[ind] - Arrive[ind] # 第ind艘船在港口的总时间plt.figure()plt.bar(Ship_Num, Finish, label='卸货时间', color='lightgreen')plt.bar(Ship_Num, Start, label='等待时间', color='red')plt.bar(Ship_Num, Arrive, label='到达时间', color='grey')plt.xlabel('船只编号')plt.ylabel('时间经历')plt.grid(axis='y')plt.legend()plt.show()# 计算港口排队系统的性能指标Total_mean = np.mean(Total)Wait_mean = np.mean(Wait)Idle_percent = sum(Idle)/Finish[-1]print("""每艘船在港口待的平均时长为:%d分钟每艘船平均等待时长为:%d分钟港口空闲时间比例:%.2f%%""" % (Total_mean, Wait_mean, Idle_percent*100))结果:

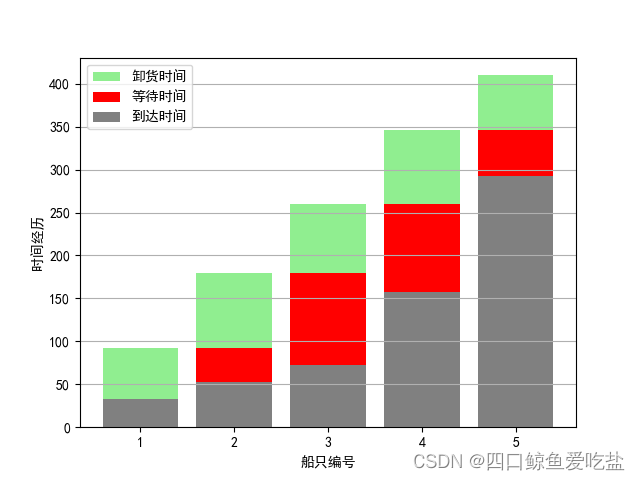
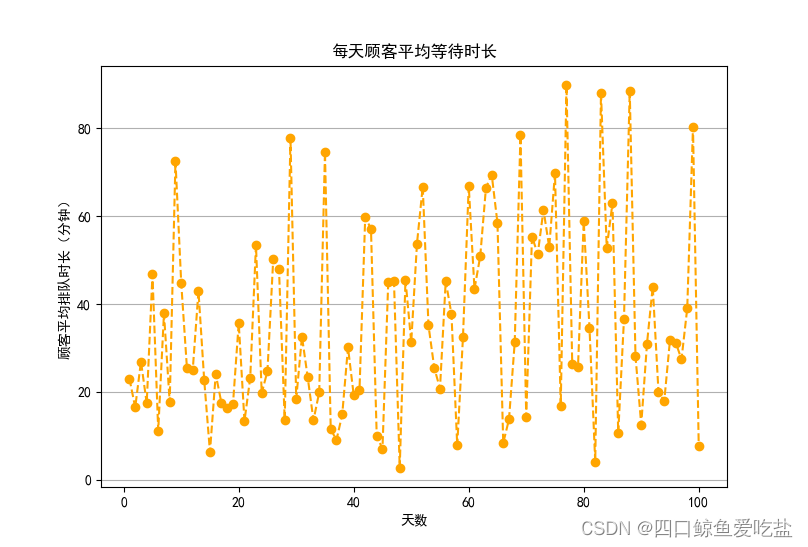
银行只有一个服务窗口,当顾客较多,一部分顾客就需要排队等待。
假设:
建立模型,求解客户平均等待时长为多少?
该问题与实例二——港口卸货非常类似,区别在于时间分布不同,代码实现如下:
import numpy as npfrom numpy import random as rdimport matplotlib.pyplot as pltimport warningswarnings.filterwarnings('ignore')# 解决图片的中文乱码问题plt.rcParams["font.sans-serif"] = ["SimHei"]plt.rcParams["axes.unicode_minus"] = FalseN = 100 # 模拟天数Total = np.zeros(N, dtype=float) # 每天客户等待总时间Average_Wait = np.zeros(N, dtype=float) # 每天客户等待平均时间for j in range(N): i = 0 # 从第一个客户开始 Arrive = [rd.exponential(10)] # 到达时间 Wait = [0] # 等待时间 Start = [Arrive[0] + Wait[0]] # 开始服务时间 Process = [rd.nORMal(10, 2)] # 服务时长 End = [Start[0] + Process[0]] # 结束服务时间 while Start[i] <= 480: # 8小时工作制 i += 1 # 对第i个客户进行模拟 Arrive.append(Arrive[i-1] + rd.exponential(10)) Start.append(max(Arrive[i], End[i-1])) Wait.append(max(0, End[i-1]-Arrive[i])) Process.append(rd.normal(10, 2)) End.append(Start[i] + Process[i]) Total[j] += Wait[i] # 计算第j天等待总时长 Average_Wait[j] = Total[j]/i # 计算第j天等待平均时长 Final_Average = np.mean(Average_Wait) # 计算总平均时长x = [i+1 for i in range(N)]plt.plot(x, Average_Wait, marker='o', linestyle='--', color='orange')plt.xlabel('天数')plt.ylabel('顾客平均排队时长(分钟)')plt.title('每天顾客平均等待时长')plt.grid(axis='y')plt.show()print("经过模拟,每位客户的平均等待时长为:%.2f分钟" % Final_Average)结果:

求解如下一个有约束的非线性规划问题: { max f = x 1 x 2 x 3 s.t. { − x 1 + 2 x 2 + 2 x 3 ≥ 0 x 1 + 2 x 2 + 2 x 3 ≤ 72 10 ≤ x 2 ≤ 20 x 1 − x 2 = 10 \begin{cases} & \text{ max} f=x_1x_2x_3 \\ & \text{ s.t. } \begin{cases} -x_1+2x_2+2x_3\geq 0 \\ x_1+2x_2+2x_3\leq 72 \\ 10\leq x_2 \leq 20\\ x_1-x_2=10 \end{cases} \end{cases} ⎩ ⎨ ⎧ maxf=x1x2x3 s.t. ⎩ ⎨ ⎧−x1+2x2+2x3≥0x1+2x2+2x3≤7210≤x2≤20x1−x2=10
对于求解该类型问题,我们先通过约束条件确定每个自变量的大概取值范围,在这些范围中随机生成若组试验点,若小组整体都满足约束条件,则划分到可行组,并从中找到函数的最值。
"""max f = x1*x2*x3s.t.-x1+2*x2+2*x3>=0x1+2*x2+2*x3<=72x2<=20 & x2>=10x1-x2 == 10有约束条件可以得到x1,x2,x3的大概取值范围其中x3满足: 5-x2/2<=x3<=31-3*x2/2 ,因此取区间[-5 16]"""import numpy as npfrom numpy import random as rdN = 1000000x2 = rd.uniform(10, 20.1, N)x1 = x2 + 10x3 = rd.uniform(-5, 16, N)f = float('-inf')for i in range(N): if -x1[i]+2*x2[i]+2*x3[i]>=0 and x1[i]+2*x2[i]+2*x3[i]<=72: result = x1[i] * x2[i] * x3[i] if result>f: f = result final_X = [x1[i], x2[i], x3[i]]print("""最终得出的最大目标函数值为:%.4f最终自变量取值为:x1 = %.4fx2 = %.4fx3 = %.4f""" % (f, final_X[0], final_X[1], final_X[2]))结果:

某同学要从六家线上商城选购五本书籍B1,B2,B3,B4,B5,每本书在不同商家的售价以及每个商家的单次运费如下表所示,请给该同学制定最省钱的选购方案。
| B1 | B2 | B3 | B4 | B5 | 运费 |
|---|---|---|---|---|---|
| A商城 | 18 | 39 | 29 | 48 | 59 |
| B商城 | 24 | 45 | 23 | 54 | 44 |
| C商城 | 22 | 45 | 23 | 53 | 53 |
| D商城 | 28 | 47 | 17 | 57 | 47 |
| E商城 | 24 | 42 | 24 | 47 | 59 |
| F商城 | 27 | 48 | 20 | 55 | 53 |
import numpy as npfrom numpy import random as rdimport matplotlib.pyplot as pltimport warningswarnings.filterwarnings('ignore')# 解决图片的中文乱码问题plt.rcParams["font.sans-serif"] = ["SimHei"]plt.rcParams["axes.unicode_minus"] = FalseFinal_Shop = rd.randint(1, 7, 5) # 初始化每本书选择的书店Final_Cost = float('inf') # 初始化花费N = 1000000 # 模拟次数Price = [[18, 39, 29, 48, 59], [24, 45, 23, 54, 44], [22, 45, 23, 53, 53], [28, 47, 17, 57, 47], [24, 42, 24, 47, 59], [27, 48, 20, 55, 53]] # 不同售价Trans = [10, 15, 15, 10, 10, 15] # 各店运费for k in range(N): Shop = list(rd.randint(1, 7, 5)) # 重新随机选择 index = list(set(Shop)) # set去除重复元素并排序 Cost = sum([Trans[i-1] for i in index]) # 计算运费 for i in range(5): Cost = Cost + Price[Shop[i]-1][i] # 计算总花费 if Cost < Final_Cost: # 更新最优值 Final_Cost = Cost Final_Shop = Shopprint("""经过模拟,这五本书分别在这些书店购买:书店%d 书店%d 书店%d 书店%d 书店%d""" % (Final_Shop[0], Final_Shop[1], Final_Shop[2], Final_Shop[3], Final_Shop[4]))print('最终花费:%d' % Final_Cost)结果:

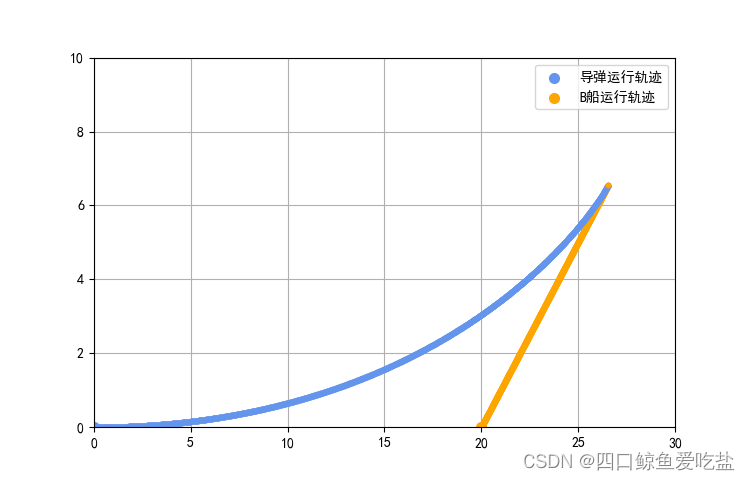
位于坐标原点的A船向位于其正东方20个单位的B船发射导弹,导弹始终对准B船,B船以时速v单位沿东北方向逃逸。若导弹的速度为3v,导弹的射程为50,画出导弹运行的曲线,导弹是否能在射程内集中B船?
本问题在使用仿真时,实际上是微元法的体现,将连续的时间均等分割为大量的离散时间,每一段时间都尽可能短。
时间 t 时的情形如下(P时导弹的坐标):
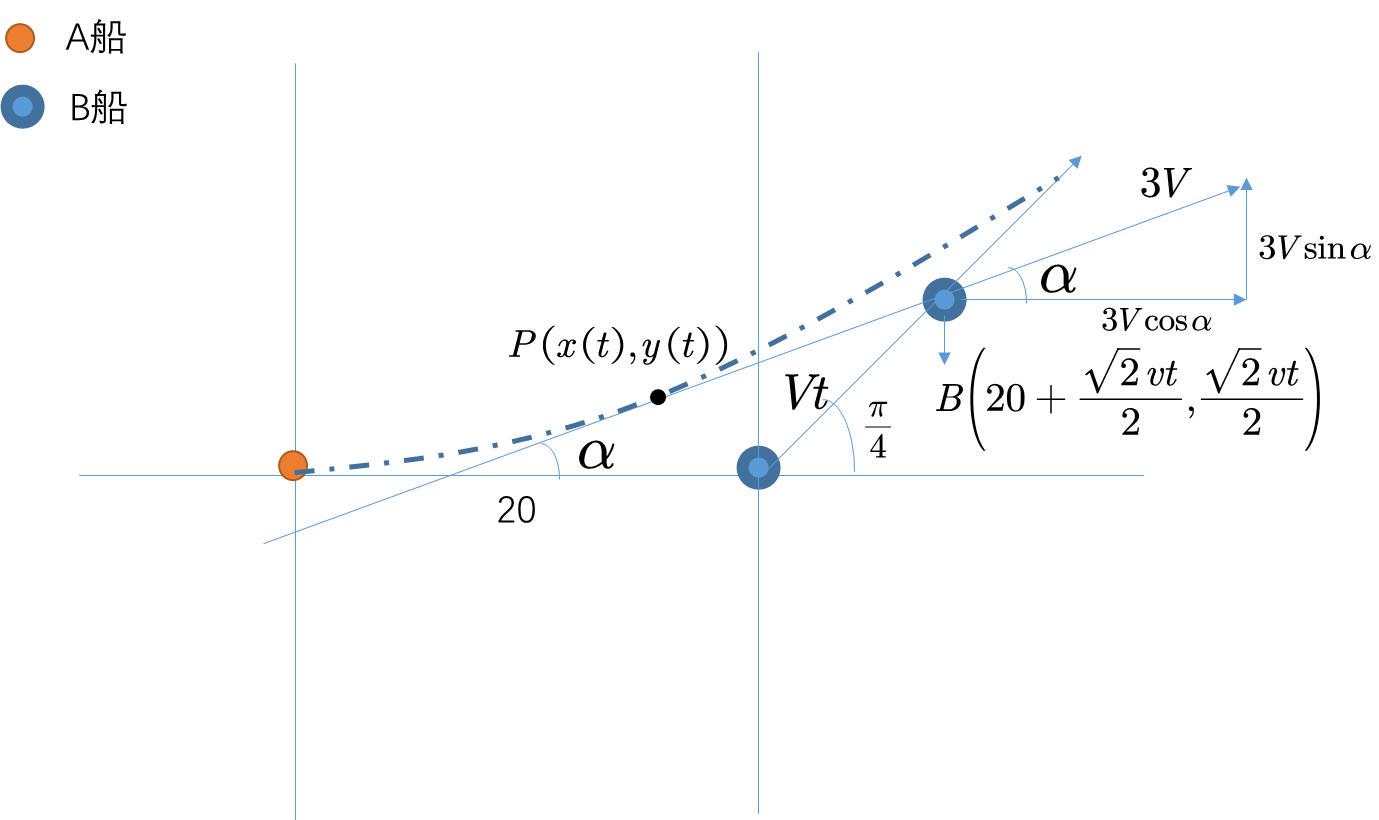
代码实现:
import numpy as npfrom numpy import random as rdimport matplotlib.pyplot as pltimport warningswarnings.filterwarnings('ignore')# 解决图片的中文乱码问题plt.rcParams["font.sans-serif"] = ["SimHei"]plt.rcParams["axes.unicode_minus"] = Falsev = 200 # 任意给定v值dt = 1e-8 # 定义时间间隔x = [0, 20] # 初始化导弹和B船的横坐标y = [0, 0] # 初始化两者的纵坐标t = 0 # 初始化时间d = 0 # 初始化导弹飞行距离m = np.sqrt(2)/2Distance = np.sqrt((x[1]-x[0])**2 + (y[1]-y[0])**2)# 导弹与B船的距离plt.figure()plt.scatter(x[0], y[0], marker='o', lw=2, color='cornflowerblue')plt.scatter(x[1], y[1], marker='o', lw=2, color='orange')plt.grid()plt.axis([0, 30, 0, 10])k = 0while Distance>=1e-5: # 击中的临界距离 t += dt # 更新时间 d += 3*v*dt # 更新导弹飞行距离 x[1] = 20 + t*v*m # 更新B船x坐标 y[1] = t*v*m # 更新B船y坐标 Distance = np.sqrt((x[1]-x[0])**2 + (y[1]-y[0])**2) # 更新两者距离 tan_alpha = (y[1]-y[0])/(x[1]-x[0]) cos_alpha = (x[1]-x[0])/Distance sin_alpha = (y[1]-y[0])/Distance x[0] += 3*v*dt*cos_alpha # 更新导弹x坐标 y[0] += 3*v*dt*sin_alpha # 更新导弹y坐标 k += 1 if k%2000==0: plt.plot(x[0], y[0], marker='.', lw=0.5, color='cornflowerblue') plt.plot(x[1], y[1], marker='.', lw=0.5, color='orange') if d>50: print('导弹没有击中B船!') break elif d<=50 and Distance<1e-5: print('导弹飞行%.2f单位距离后击中B船.' % d) print('导弹飞行时间为%.2f分钟' % (t*60))plt.legend(['导弹运行轨迹', 'B船运行轨迹'])plt.show()结果:

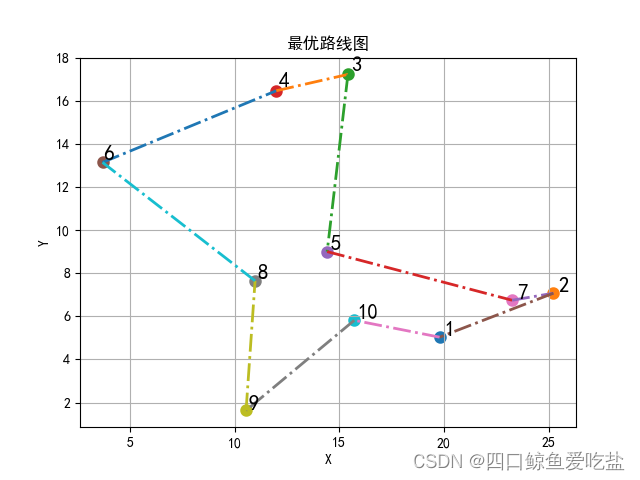
一个售货员必须访问10个城市,这10个城市可用完全图表示,售货员需要恰好访问所有城市一次,并且回到最初的城市。售货员希望旅行距离之和最少。
完全图:一种简单的无向图,其中每对不同的顶点之间都恰有一条边相连
import numpy as npfrom numpy import random as rdimport matplotlib.pyplot as pltimport warningswarnings.filterwarnings('ignore')# 解决图片的中文乱码问题plt.rcParams["font.sans-serif"] = ["SimHei"]plt.rcParams["axes.unicode_minus"] = Falseimport numpy as npfrom numpy import random as rdimport matplotlib.pyplot as pltimport warningswarnings.filterwarnings('ignore')# 解决图片的中文乱码问题plt.rcParams["font.sans-serif"] = ["SimHei"]plt.rcParams["axes.unicode_minus"] = False# 随机生成10个城市的坐标Position = rd.uniform(1, 26, (10, 2))N = len(Position)# 画出城市的分布散点图,并添加标签plt.figure()name = [str(i) for i in range(1, N+1)]for j in range(N): i = Position[j] plt.scatter(i[0], i[1], marker='o', lw=3) plt.text(i[0]*1.01, i[1]*1.01, name[j], fontsize=15, weight=6)# 初始化城市之间的距离矩阵Distance = np.zeros((10, 10))# 循环计算出距离矩阵for i in range(1, N): for j in range(i): Position_i = Position[i] x_i = Position_i[0] y_i = Position_i[1] Position_j = Position[j] x_j = Position_j[0] y_j = Position_j[1] # 对称矩阵 Distance[j][i] = Distance[i][j] = np.sqrt((x_i-x_j)**2 + (y_i-y_j)**2)# 初始化最小距离和对应的路径Min_Cost = float('inf')Min_Path = [i for i in range(N)]# 模拟次数Num = 10000Cost_list = []# 不断模拟得到最优路径for i in range(Num): Cost = 0 Path = [i for i in range(N)] rd.shuffle(Path) for j in range(N-1): Cost = Distance[Path[j]][Path[j+1]]+Cost Cost = Distance[Path[0]][Path[-1]]+Cost if Cost<Min_Cost: Min_Path = Path Min_Cost = Cost if (i+1)%100==0: Cost_list.append(Min_Cost)Min_Path.append(Min_Path[0])N = N+1# 依次画出路径for i in range(N-1): j = i+1 Position_i = Position[Min_Path[i]] x_i = Position_i[0] y_i = Position_i[1] Position_j = Position[Min_Path[j]] x_j = Position_j[0] y_j = Position_j[1] plt.plot([x_i, x_j], [y_i, y_j], linestyle='-.', lw=2)plt.xlabel('X')plt.ylabel('Y')plt.title('最优路线图')plt.grid()plt.show()plt.figure()X = [(i+1)*100 for i in range(len(Cost_list))]plt.plot(X, Cost_list, linestyle='--', marker='1',lw=2)plt.xlabel('迭代次数')plt.ylabel('最短距离')plt.title('收敛曲线图')plt.grid(axis='y')plt.show()p = [i+1 for i in Min_Path]print("""最短距离为:%.2f对应路径为:%d->%d->%d->%d->%d->%d->%d->%d->%d->%d->%d""" % (Min_Cost, p[0], p[1], p[2], p[3], p[4], p[5], p[6], p[7], p[8], p[9], p[10]))结果:


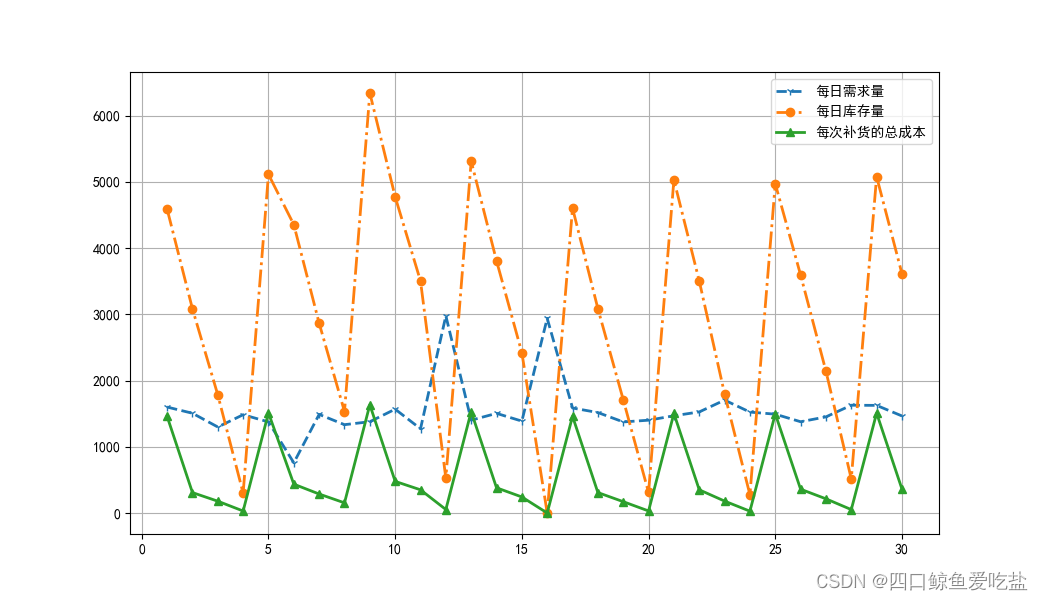
你作为加油站的顾问,需要为加油站设计补货策略:补充频率和补充量。已知每次补货的运输费用:d(花费固定,与油量无关),还需要考虑油的存储费用(费用与油量相关)。如何设计方案,使得加油站成本最小,同时能够满足顾客的需求?
每日油量需求的历史数据:
| 需要的油量 | 频次 | 频率 |
|---|---|---|
| 1000——1099 | 10 | 0.01 |
| 1100——1199 | 20 | 0.02 |
| 1200——1299 | 50 | 0.02 |
| 1300——1399 | 120 | 0.12 |
| 1400——1499 | 200 | 0.2 |
| 1500——1599 | 270 | 0.27 |
| 1600——1699 | 180 | 0.18 |
| 1700——1799 | 80 | 0.08 |
| 1800——1899 | 40 | 0.04 |
| 1900——1999 | 30 | 0.03 |
| 总天数 | 1000 | 1 |
根据经济批量补货公式:
最佳补货周期: T ∗ = 2 d s r T^{*}=\sqrt{\frac{2d}{sr}} T∗=sr2d
最佳补货量: Q ∗ =r T ∗ Q^{*}=rT^{*} Q∗=rT∗
r r r:每天的需求量
d d d:每次补货的运输费用
s s s:每天单位油量的花费
首先,根据题目中油量需求的历史数据,用频率估计概率,并结合均匀分布与插值算法,模拟估计出每日需求量(本文省略计算过程,只体现最后结果):
import numpy as npfrom numpy import random as rdimport matplotlib.pyplot as pltimport warningswarnings.filterwarnings('ignore')# 解决图片的中文乱码问题plt.rcParams["font.sans-serif"] = ["SimHei"]plt.rcParams["axes.unicode_minus"] = False# 随机产生每日需求量def gasoline_demand_function(x): """ 需求量的估计本函数是利用插值拟合得出的结果 :param x: 传入0-1的随机值或数组(列表) :return: 对应的需求量列表 """ request = [] for i in x: re = 0 re = (i < 0.01) * (i + 0.2) * 5000 + \ (i >= 0.01 and i < 0.03) * (i + 0.2) * 5000 + \ (i >= 0.03 and i < 0.08) * (i + 0.545) * 2000 + \ (i >= 0.08 and i < 0.20) * (i + 1.42) * 833.33 + \ (i >= 0.20 and i < 0.40) * (i + 2.5) * 500 + \ (i >= 0.40 and i < 0.67) * (i + 3.515) * 370.37 + \ (i >= 0.67 and i < 0.85) * (i + 2.12) * 555.55 + \ (i >= 0.85 and i < 0.93) * (i + 0.472) * 1250 + \ (i >= 0.93 and i < 0.97) * (i + 0.23) * 2500 + \ (i >= 0.97) * (i - 0.6) * 2000 request.append(re) return requestN = 30 # 模拟天数I = np.zeros(N+1) # 每日结束后的库存量D = np.zeros(N) # 每天油的运送补充量d = 1000 # 设置每次运费s = 0.1 # 设置每天每单位油的存储费用C = np.zeros(N) # 每天结束后的总成本q = np.zeros(N) # 每天油的需求量q = gasoline_demand_function(rd.random(N))r = np.mean(q)T = int(np.round(np.sqrt(2*d/(s*r)))) # round四舍五入,int转为整数Q = r*T # 最优补货量D[0:-1:T] = Q # 每T天补充油量QC[0:-1:T] = d # 运费for i in range(N): I[i+1] = max(I[i]+D[i]-q[i], 0) # 每天库存量要大于等于0 C[i] += I[i+1]*s # 存储成本# 可视化plt.figure()t = [i for i in range(1, N+1)]plt.plot(t, q, linestyle='--', marker='1', lw=2)plt.plot(t, I[1::], linestyle='-.', marker='o', lw=2)plt.plot(t, C, linestyle='-', marker='^', lw=2)plt.legend(['每日需求量', '每日库存量', '每次补货的总成本'])plt.grid()plt.show()结果:
某设备上安装有四只型号规格完全相同的电子管,已知电子管寿命为 1000h~2000h 之间的均匀分布。当电子管损坏时有两种维修方案,一是每次更换损坏的那 1 只;二是当其中一只损坏时同时把 4 只同时更换。
已知更换 1 只需要 1h,同时更换 4 只需要 2 h,更换时设备因为停止运转每小时损失 20 元,每只电子管价格 10 元,试确定哪一个方案更经济。
import numpy as npfrom numpy import random as rdimport matplotlib.pyplot as pltimport warningswarnings.filterwarnings('ignore')# 解决图片的中文乱码问题plt.rcParams["font.sans-serif"] = ["SimHei"]plt.rcParams["axes.unicode_minus"] = FalseT = 1000000t = 0Cost01 = 0Cost02 = 0while t<T: life = (rd.randint(1000, 2000, 4)).tolist() first = min(life) t += first+1 Cost01 += 20*1 + 10 ind = life.index(first) life = [(i-first-1) for i in life] life[ind] = rd.randint(1000, 2000)t = 0while t<T: life = (rd.randint(1000, 2000, 4)).tolist() first = min(life) t += first+2 Cost02 += 20*2 + 40print("""方案一花费:%d方案二花费:%d""" % (Cost01, Cost02))结果:

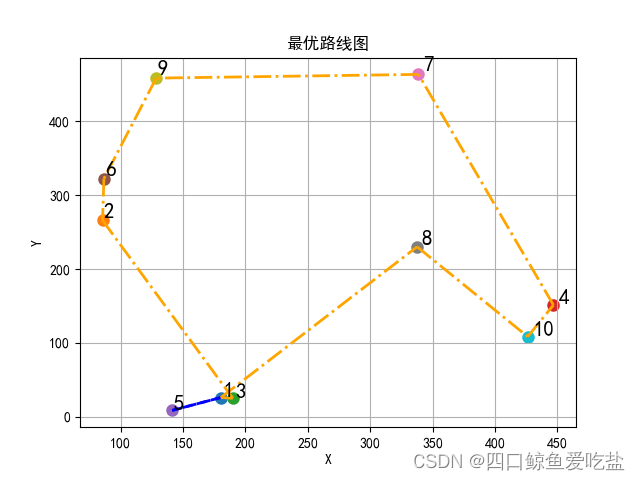
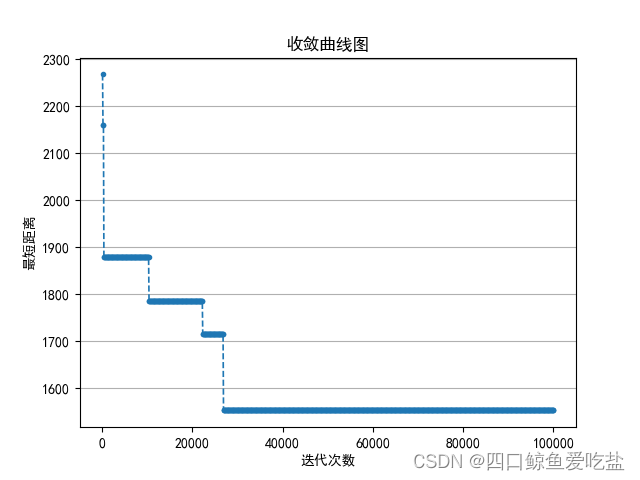
有两个售货员必须访问20个城市,这20个城市可用完全图表示,售货员需要恰好访问所有城市一次,并且回到最初的城市(两售货员从同一城市出发,称之为 中心城市)。售货员希望旅行距离之和最少。
完全图:一种简单的无向图,其中每对不同的顶点之间都恰有一条边相连
思路和单旅行商问题类似,只不过每次要选取中心城市,并随机分配城市。
import numpy as npfrom numpy import random as rdimport matplotlib.pyplot as pltimport warningswarnings.filterwarnings('ignore')# 解决图片的中文乱码问题plt.rcParams["font.sans-serif"] = ["SimHei"]plt.rcParams["axes.unicode_minus"] = Falseimport numpy as npfrom numpy import random as rdimport matplotlib.pyplot as pltimport warningswarnings.filterwarnings('ignore')# 解决图片的中文乱码问题plt.rcParams["font.sans-serif"] = ["SimHei"]plt.rcParams["axes.unicode_minus"] = False# 随机生成10个城市的坐标city_num = 10Position = rd.uniform(0, 500, (city_num, 2))N = len(Position)# 画出城市的分布散点图,并添加标签plt.figure()name = [str(i) for i in range(1, N+1)]for j in range(N): i = Position[j] plt.scatter(i[0], i[1], marker='o', lw=3) plt.text(i[0]*1.01, i[1]*1.01, name[j], fontsize=15, weight=6)# 初始化城市之间的距离矩阵Distance = np.zeros((N, N))# 循环计算出距离矩阵for i in range(1, N): for j in range(i): Position_i = Position[i] x_i = Position_i[0] y_i = Position_i[1] Position_j = Position[j] x_j = Position_j[0] y_j = Position_j[1] # 对称矩阵 Distance[j][i] = Distance[i][j] = np.sqrt((x_i-x_j)**2 + (y_i-y_j)**2)# 初始化最小距离和对应的路径Min_Cost = float('inf')Min_Path = [i for i in range(N)]Min_Cen = rd.randint(0, N)Min_Cut = rd.randint(0, N - 1)Min_Center = Min_Path[Min_Cen] # 随机选取初始城市Min_Path.pop(Min_Cen) # 从路径中去除初始城市Min_Path01 = Min_Path[0:Min_Cut] # 第一个售货员的路径Min_Path02 = Min_Path[Min_Cut::] # 第二个售货员的路径Num = 100000 # 模拟次数Cost_list = [] # 存储迭代过程中的距离# 不断模拟得到最优路径for i in range(Num): Cost = 0 Cost01 = Cost02 = 0 Path = [i for i in range(N)] rd.shuffle(Path) Cen = rd.randint(0, N) Cut = rd.randint(1, N - 1) Center = Path[Cen] # 随机选取初始城市编号 Path.pop(Cen) # 从路径中去除初始城市 Path01 = Path[0:Cut] # 第一个售货员的路径 Path02 = Path[Cut::] # 第二个售货员的路径 for j in range(len(Path01)-1): Cost01 += Distance[Path01[j]][Path01[j+1]] Cost01 += Distance[Center][Path01[0]] + Distance[Center][Path01[-1]] for k in range(len(Path02)-1): Cost02 += Distance[Path02[k]][Path02[k+1]] Cost02 += Distance[Center][Path02[0]] + Distance[Center][Path02[-1]] Cost = Cost01 + Cost02 if Cost<Min_Cost: Min_Path01 = Path01 Min_Path02 = Path02 Min_Cost = Cost Min_Center = Center if (i+1)%100==0: Cost_list.append(Min_Cost)Min_Path01.insert(0, Min_Center)Min_Path01.append(Min_Center)Min_Path02.insert(0, Min_Center)Min_Path02.append(Min_Center)# 依次画出路径# 第一个售货员路径for i in range(len(Min_Path01)-1): j = i+1 Position_i = Position[Min_Path01[i]] x_i = Position_i[0] y_i = Position_i[1] Position_j = Position[Min_Path01[j]] x_j = Position_j[0] y_j = Position_j[1] plt.plot([x_i, x_j], [y_i, y_j], linestyle='--', lw=2, color='blue')# 第二个售货员路径for i in range(len(Min_Path02)-1): j = i + 1 Position_i = Position[Min_Path02[i]] x_i = Position_i[0] y_i = Position_i[1] Position_j = Position[Min_Path02[j]] x_j = Position_j[0] y_j = Position_j[1] plt.plot([x_i, x_j], [y_i, y_j], linestyle='-.', lw=2, color='orange')plt.xlabel('X')plt.ylabel('Y')plt.title('最优路线图')plt.grid()plt.show()plt.figure()X = [(i+1)*100 for i in range(len(Cost_list))]plt.plot(X, Cost_list, linestyle='--', marker='.',lw=1.2)plt.xlabel('迭代次数')plt.ylabel('最短距离')plt.title('收敛曲线图')plt.grid(axis='y')plt.show()Min_Path01 = [(i+1) for i in Min_Path01]Min_Path02 = [(i+1) for i in Min_Path02]print('中心城市编号为:', Min_Center+1)print('1号售货员路径为:', Min_Path01)print('2号售货员路径为:', Min_Path02)print('两者最短距离之和为:', Min_Cost)结果:

来源地址:https://blog.csdn.net/qq_60090693/article/details/128368436
--结束END--
本文标题: 【Python与数学建模】蒙特卡洛模拟&仿真(附完整详细代码)
本文链接: https://lsjlt.com/news/416160.html(转载时请注明来源链接)
有问题或投稿请发送至: 邮箱/279061341@qq.com QQ/279061341
2024-03-01
2024-03-01
2024-03-01
2024-02-29
2024-02-29
2024-02-29
2024-02-29
2024-02-29
2024-02-29
2024-02-29
回答
回答
回答
回答
回答
回答
回答
回答
回答
回答
0