目录一、React项目快速搭建1、新建文件夹2、直接在对应目录输入 cmd ,打开终端3、执行指令完成React应用建立二、React项目结构和分析1、删除多于文件,使得结构清晰2、
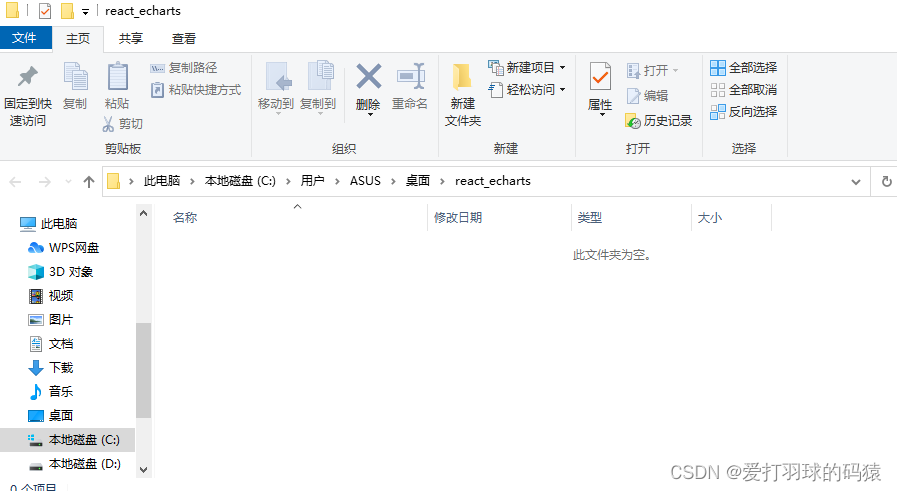
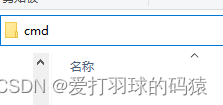
npx create-react-app react_echarts_demo

cd react_echarts_demo
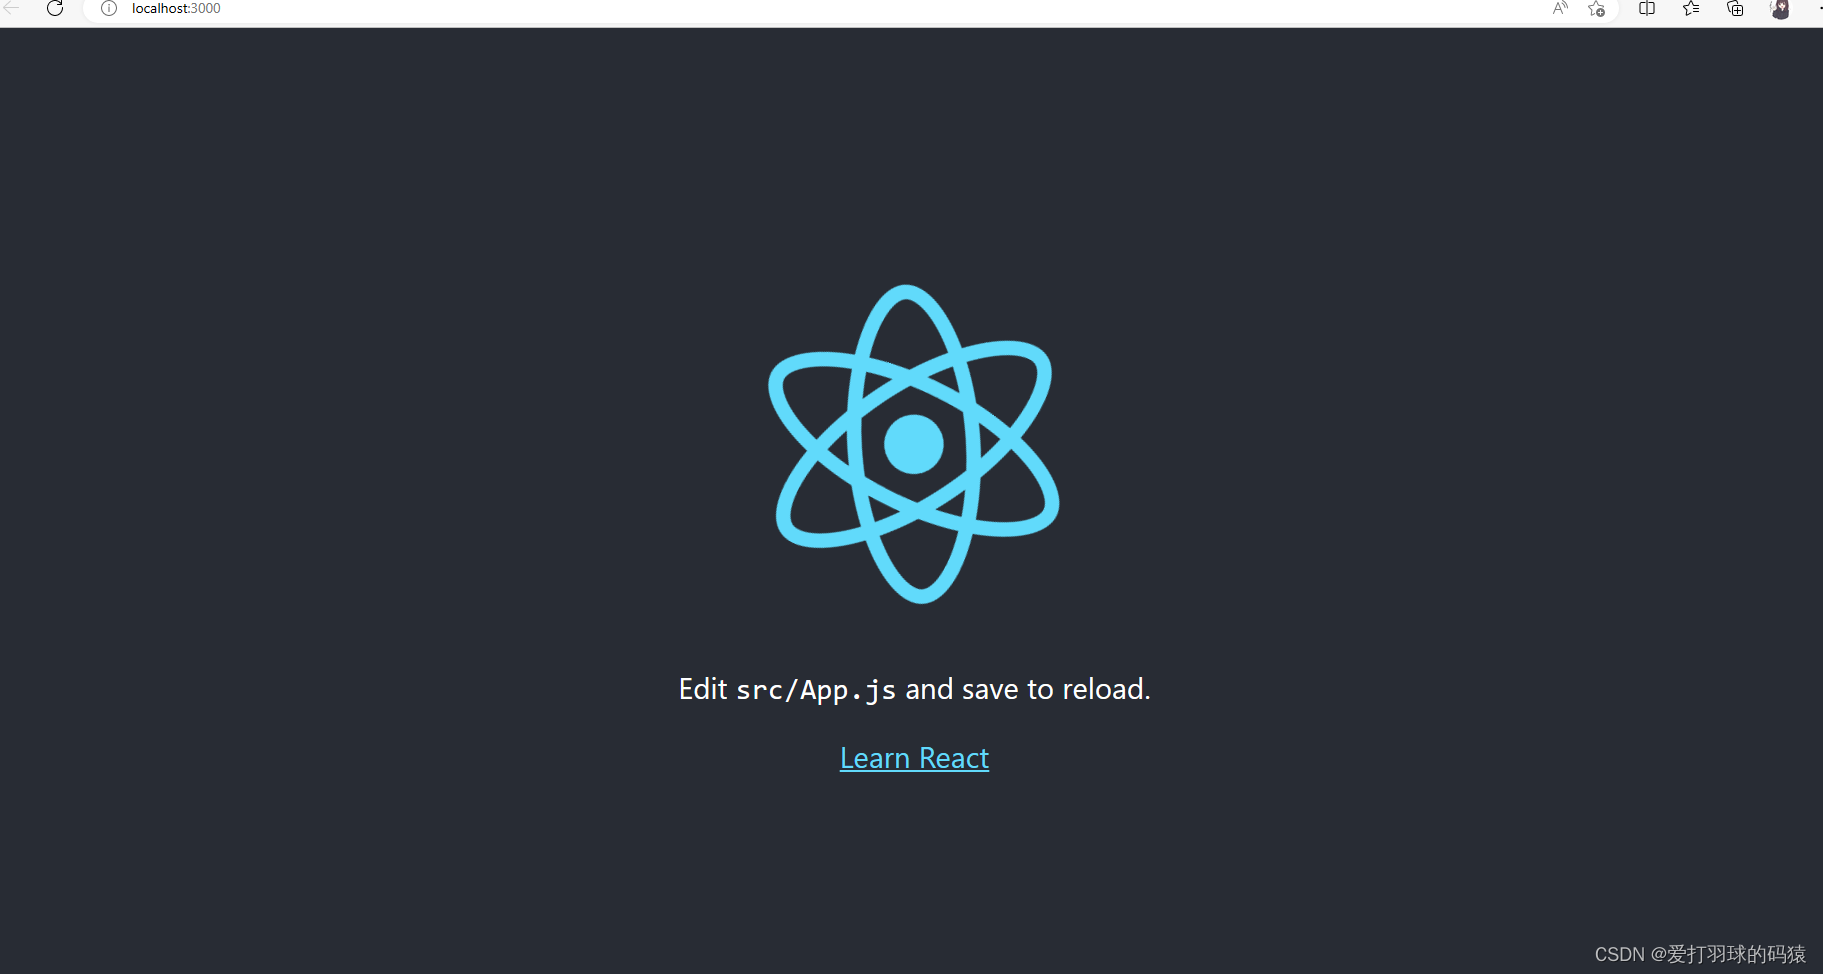
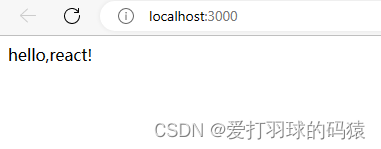
npm start

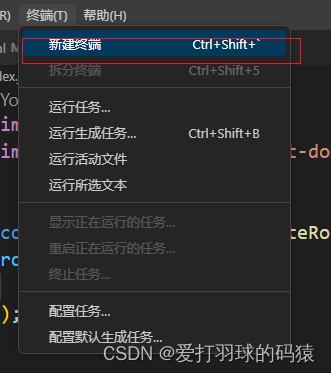
终端对应目录下输入 code . 打开 vs code
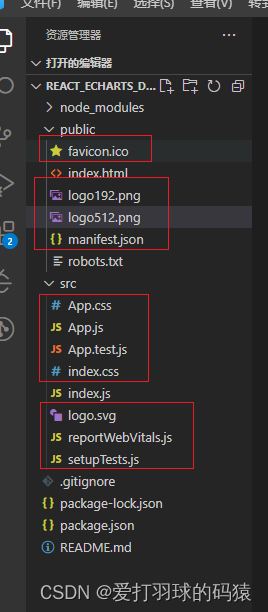


npm install echarts --save
npm install --save echarts-for-react
使用 echarts-for-react

引用代码
import React from 'react';
import ReactDOM from 'react-dom/client';
import LineCharts  from './LineCharts';

const root = ReactDOM.createRoot(document.getElementById('root'));

root.render(
  <div>
    <h1> 简单折线图</h1>
    <LineCharts></LineCharts>
  </div>
);
组件代码
import React, {Component} from 'react';
import ReactECharts from 'echarts-for-react';


// 在此组件中绘制一个简单的折线图
export default class LineCharts  extends Component{
  // 返回折线图的配置对象
  option = {
    xAxis: {
      type: 'cateGory',
      data: ['A', 'B', 'C']
    },
    yAxis: {
      type: 'value'
    },
    series: [
      {
        data: [120, 200, 150],
        type: 'line'
      }
    ]
  };

  render() {
    return(
      <div>
        <ReactECharts option={this.option} />
      </div>
    )
  }
}
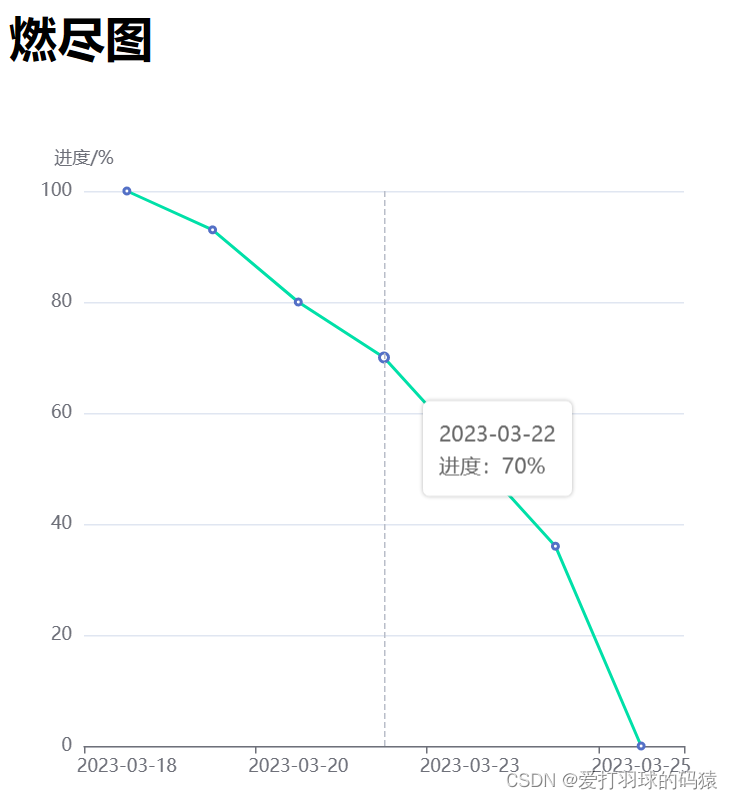
代码如下:
index.js
import React from 'react';
import ReactDOM from 'react-dom/client';
import LineEChartsDemo  from './LineEchartsDemo';

const root = ReactDOM.createRoot(document.getElementById('root'));

root.render(
  <div>
    <h1>燃尽图</h1>
    <LineEChartsDemo></LineEChartsDemo>
  </div>
);
LineEchartsDemo.jsx
import React, { Component } from 'react'
import LineECharts from './LineECharts'


class LineEchartsDemo extends Component{

  constructor(props) {
    super(props)
    this.state = {
	    data: {
	      x: ['2023-03-18', '2023-03-19', '2023-03-20', '2023-03-22', '2023-03-23', '2023-03-24', '2023-03-25'],
	      y: [100, 93, 80, 70, 53, 36, 0]
	    }
    }
  }
  componentDidMount() { }
  render() {
     	return (<LineECharts data={this.state.data} yname="进度/%" />  )
  }
}

export default LineEchartsDemo
LineECharts.jsx
import React, {Component} from 'react';

import * as echarts from 'echarts';


export default class LineECharts  extends Component{
  constructor(props) {
    super(props)
    this.state = {
    }
  }

  // 挂载完成之后,因为React初始化echarts时长宽可能会获取到顶层,所以延迟200去生成,不影响视觉效果
  componentDidMount() {
    setTimeout(() => {
      this.initEchart(this.props.data)
    }, 200)
  }

  // 更新props以后调用
  componentWillReceiveProps(newProps) {
    this.initEchart(newProps.data)
  }

  initEchart = (data) => {
    let myEcharts = echarts.init(this.echartsBox)
    let option = {

      title: {
        text: this.props.title || '',
        left: 'center',
        top: '0'
      },
      tooltip: {
        show: true,
        trigger: 'axis',

        fORMatter: '{b}<br/>进度:{c}%',
        extraCSSText: 'box-shadow: 0 0 3px rgba(0, 0, 0, 0.3);'
      },
      xAxis: {
        type: 'category',
        data: data.x,
      },
      yAxis: {
        name: this.props.yname,
        nameGap: 15,
        position: 'left',
        axisLabel: {
          formatter: '{value}'
        }
      },
      series: [{
        name: '汇总',
        type: 'line',
        data: data.y,
        smooth: false,
        lineStyle: {
          color: '#00CC99',
          width: 2
        },

      }]
    }
    myEcharts.setOption(option)
    myEcharts.on('finished', () => {
      myEcharts.resize()
    })
  }

  render() {
    return (
      <div ref={(c) => { this.echartsBox = c }} style={{ width: '500px', height: '500px' }} />
    )
  }
}
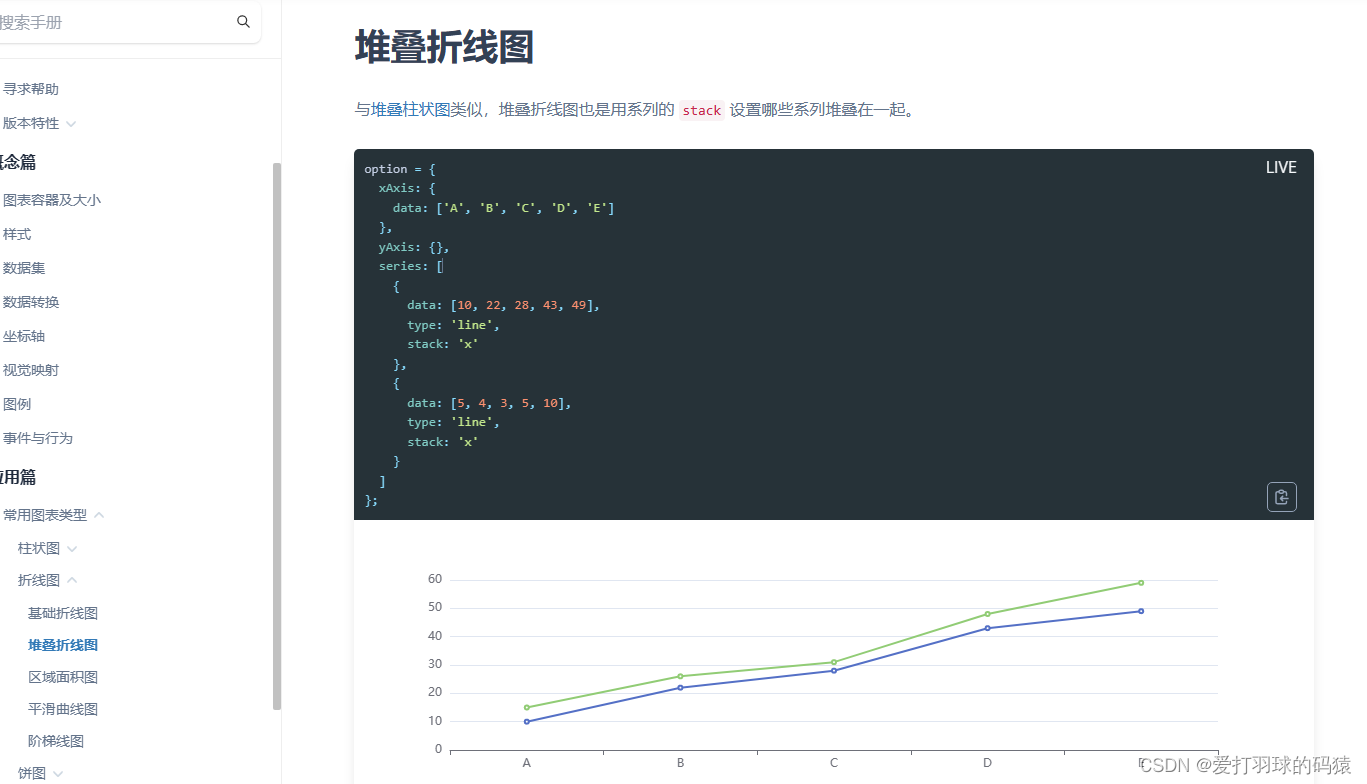
option = {
  xAxis: {
    data: ['A', 'B', 'C', 'D', 'E']
  },
  yAxis: {},
  series: [
    {
      data: [10, 22, 28, 43, 49],
      type: 'line',
      stack: 'x'
    },
    {
      data: [5, 4, 3, 5, 10],
      type: 'line',
      stack: 'x'
    }
  ]
};到此这篇关于React项目搭建与Echars工具使用的文章就介绍到这了,更多相关React使用Echars内容请搜索编程网以前的文章或继续浏览下面的相关文章希望大家以后多多支持编程网!
--结束END--
本文标题: React项目搭建与Echars工具使用详解
本文链接: https://lsjlt.com/news/200588.html(转载时请注明来源链接)
有问题或投稿请发送至: 邮箱/279061341@qq.com QQ/279061341
2024-01-12
2023-05-20
2023-05-20
2023-05-20
2023-05-20
2023-05-20
2023-05-20
2023-05-20
2023-05-20
2023-05-20
回答
回答
回答
回答
回答
回答
回答
回答
回答
回答
0