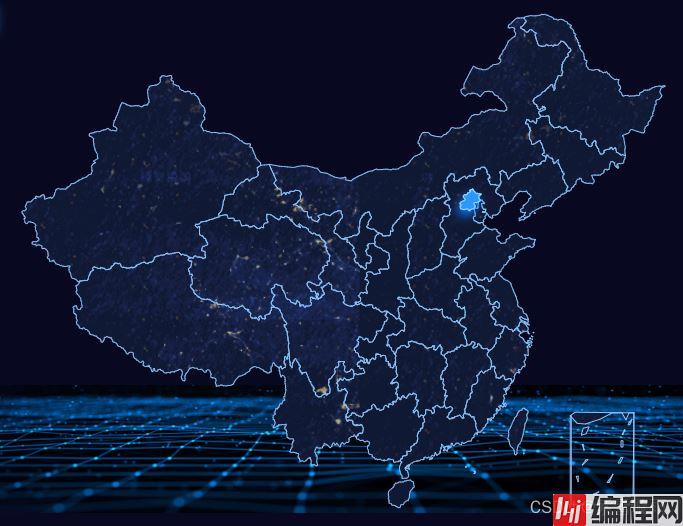
目录1、地图设置背景图片2、地图外部多层轮廓线3、地图海岸线4、地图中高亮显示有数据的城市5、滚动高亮轮播总结 1、地图设置背景图片 // data domImg: require(

// data
domImg: require('@/assets/images/largescreen/nation/map_bg.png'),

// js 渲染地图之前
var domImg = document.createElement("img");
domImg.style.height = domImg.height = domImg.width = domImg.style.width = "100px";
domImg.src = that.domImg;

// js 渲染地址时,在地图配置项geo中itemStyle
nORMal: {
    areaColor: {
        type: "pattern",
        image: domImg, //配置图片
        repeat: "repeat", //可选值repeat、no-repeat、repeat-x、repeat-y
    },
}
首先来看单层加粗外边框,其实很简单。咱们看一下效果
// 在地图配置项series中添加样式,效果如下图
itemStyle: {
       normal: {
           areaColor: '#3075b2',
           borderColor: '#4c99f9',
           borderWidth: 1
       },
       emphasis: {
           areaColor: '#01215c'
       }
}
// 在地图的配置项geo中设置,效果如下图
itemStyle: {
       normal: {
           areaColor: '#01215c',
           borderWidth: 5,//设置外层边框
           borderColor:'#9ffcff',
       }
}
在地图配置项series、geo中设置边框,单独设置就是上图所示。一起设置如下图,中间边框细,外轮廓边框粗的效果。
外轮廓加投影就是在 geo中添加 shadowColor设置,以及偏移shadowOffsetX、shadowOffsetY、shadowBlur。
如果想要多层外轮廓,就是在geo设置多个对象。
// 通过偏移,缩放来实现多层外轮廓的效果
this.option.geo = [
          {
            // 主图
            map: map,
            zlevel: 0,
            zoom: 1.2, //当前视角的缩放比例
            roam: false, //是否开启平游或缩放
            center: undefined,
            show: true,
            label: {
              normal: {
                show: false,
              },
              emphasis: {
                show: false,
              },
            },
            itemStyle: {
              normal: {
                borderColor: "rgba(141, 199, 255,1)",
                borderWidth: 1,
                areaColor: {
                  type: "pattern",
                  image: domImg, //配置图片
                  repeat: "repeat", //可选值repeat、no-repeat、repeat-x、repeat-y
                },
              },
              emphasis: {
                areaColor: "#2d9eff", //悬浮区背景
                shadowColor: "rgba(20, 113, 255,1)",
                shadowOffsetX: -2,
                shadowOffsetY: 5,
                shadowBlur: 10,
              },
            },
          },
          //第一层投影
          {
            map: map,
            zlevel: -1,
            zoom: 1.22, //当前视角的缩放比例
            roam: false, //是否开启平游或缩放
            center: undefined,
            show: true,
            label: {
              normal: {
                show: false,
              },
              emphasis: {
                show: false,
              },
            },
            itemStyle: {
              normal: {
                borderJoin: "round",
                borderColor: "rgba(176,228,252,1)",
                borderWidth: 3,
                areaColor: "rgba(133,188,232,1)",
                shadowColor: "rgba(133,188,232,.7)",
                shadowOffsetX: 0,
                shadowOffsetY: 0,
                shadowBlur: 25,
              },
              emphasis: {
                show: false,
              },
            },
          },
          // 第二层投影
          {
            map: map,
            zlevel: -2,
            zoom: 1.2, //当前视角的缩放比例
            roam: false, //是否开启平游或缩放
            center: undefined,
            show: true,
            label: {
              normal: {
                show: false,
              },
              emphasis: {
                show: false,
              },
            },
            itemStyle: {
              normal: {
                borderJoin: "round",
                areaColor: "rgba(30,49,105,1)",
                shadowColor: "rgba(30,49,105,1)",
                shadowOffsetX: -5,
                shadowOffsetY: 6,
              },
              emphasis: {
                show: false,
              },
            },
          },
}
在echarts中regions是对特定的区域配置样式,opacity中0的时候不会绘制该图形,所以根据regions配置项来清除一部分图形。这样一来,直接在一个map上是不能实现海岸线效果的。那就需要两个div地图来实现海岸线效果。一层map是顶层的,完整数据的地图,一层是去掉海岸想相关数据的地图层。


// 首先把一部分图形隐藏
regionsOption:[
    {
      name: "北京市",
      itemStyle: {
        // 隐藏地图
        normal: {
          opacity: 0, // 为 0 时不绘制该图形
        }
      },
      label: {
        show: false // 隐藏文字
      }
    },

    ......

    {
      name: "南海诸岛",
      itemStyle: {
        // 隐藏地图
        normal: {
          opacity: 0, // 为 0 时不绘制该图形
        }
      },
      label: {
        show: false // 隐藏文字
      }
    },
  ]
完整的地图数据我是从DataV.GeoAtlas下载的。
对某些省份图形的隐藏之后,发现,辽宁、广西在海岸线中只占一部分,就不能根据隐藏图形来实现了。但是可以修改地图绘制的经纬度,把辽宁、广西的一部分经纬度绘制去掉就可以得到下图效果。 下载海岸线除去辽宁广西部分经纬度JSON数据

数据高亮显示,在地图配置项series中data中设置itemStyle.areaColor。还可以加scatter,effectScatter都可以,根据需求来定。
// series-map.data.itemStyle地图数据高亮显示
var data = [
    { name: '天津', value: 4075, itemStyle: {areaColor: '#faa'} },
    { name: '湖北', value: 500, itemStyle: {areaColor: '#faa'} }
];


// series-effectScatter带有涟漪特效动画的散点(气泡)图
// this.convertData() 的数据格式:根据获取地图的数据,筛选出和data对应的数据,格式:[{name: 'name', value: 'value'}]
{
          type: "effectScatter",
          coordinateSystem: "geo",
          data: this.convertData(),
          // geoIndex:1,
          symbolSize: function (val) {
            return 10;
          },
          showEffectOn: "render",
          rippleEffect: {
            brushType: "stroke",
          },
          hoverAnimation: true,
          label: {
            normal: {
              formatter: "{b}",
              position: "top",
              show: true,
              color: "#fff",
              fontSize: 10,
              fontWeight: 800,
            },
          },
          itemStyle: {
            normal: {
              color: "#fdfbcc",
              shadowBlur: 10,
              shadowColor: "#fdfbcc",
            },
          },
          zlevel: 1,
        },
根据dispatchAction来设置地图的配置项,和定时器相结合来实现滚动高亮显示
// 设置鼠标移入移出地图以及点击地图
mounted() {
    this.$nextTick(() => {
      this.initEcharts();
      let that = this;
      this.chart.on("click", this.echartsMapClick);
      this.chart.on("mouseover", this.echartsMapMouseover);
      this.chart.on("mouseout", this.echartsMapMouseout);
    })
}


    // 地图鼠标移入事件
    echartsMapMouseover() {
      clearInterval(this.tooltipAutoplay);
    },
    // 地图鼠标移出事件
    echartsMapMouseout() {
      this.setTooltipAutoplay();
    },
    // 动态显示tooltip
    setTooltipAutoplay() {
      clearInterval(this.tooltipAutoplay);
      var index = 0; //播放所在下标
      var itemIndexList = new Array(this.mapDataList.length); //固定数组长度为3
      for (var i = 0; i < itemIndexList.length; i++) {
        itemIndexList[i] = i;
      }
      this.tooltipAutoplay = setInterval(() => {
        this.chart.dispatchAction({
          type: "downplay",
          seriesIndex: 0,
          dataindex: itemIndexList,
        });
        this.chart.dispatchAction({
          type: "showTip",
          seriesIndex: 0,
          dataIndex: this.tooltipAutoplayIndex,
        });
        this.chart.dispatchAction({
          type: "highlight",
          seriesIndex: 0,
          dataIndex: this.tooltipAutoplayIndex,
        });
        this.tooltipAutoplayIndex++;
        if (this.tooltipAutoplayIndex >= this.mapDataList.length) {
          this.tooltipAutoplayIndex = 0;
          this.setTooltipAutoplay();
        }
      }, 6666);
    },
到此这篇关于echarts地图设置背景图片及海岸线的文章就介绍到这了,更多相关echarts地图设置背景图片 海岸线内容请搜索编程网以前的文章或继续浏览下面的相关文章希望大家以后多多支持编程网!
--结束END--
本文标题: echarts地图设置背景图片及海岸线实例代码
本文链接: https://lsjlt.com/news/174732.html(转载时请注明来源链接)
有问题或投稿请发送至: 邮箱/279061341@qq.com QQ/279061341
2024-01-12
2023-05-20
2023-05-20
2023-05-20
2023-05-20
2023-05-20
2023-05-20
2023-05-20
2023-05-20
2023-05-20
回答
回答
回答
回答
回答
回答
回答
回答
回答
回答
0