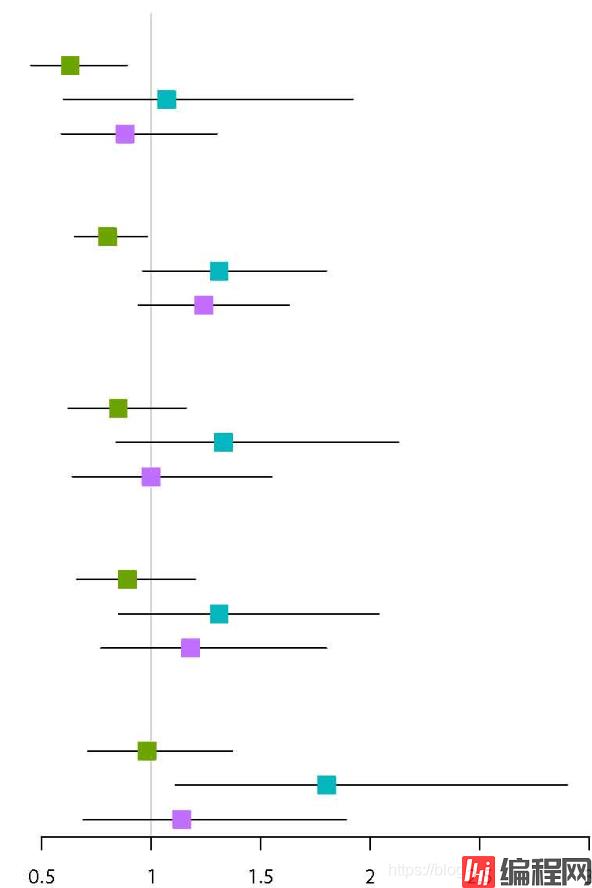
目录分组设置颜色给每行增加辅助线分组设置颜色 library(forestplot) fn <- local({ i = 0 function(..., clr.lin
library(forestplot)
fn <- local({
  i = 0
  function(..., clr.line, clr.marker){
    i <<- i + 1
    if(i%%4==3){fpDrawNORMalCI(..., clr.line = "#000000", clr.marker = "#00B9BF")} #4组中的第3组
    else if(i%%4==0){fpDrawNormalCI(..., clr.line = "#000000", clr.marker = "#C26EFF")} #4组中的第4组
    else if(i%%4==2 ){fpDrawNormalCI(..., clr.line = "#000000", clr.marker = "#6DA500")} #4组中的第2组
    else(fpDrawNormalCI(..., clr.line = "#000000", clr.marker = "#F9675C")) #4组中的第1组
  }
})
tabletext=cbind(c("Outcomes",figure_2_data$Treatmeant),c("CI (95%OR)",figure_2_data$`OR (95% CI)*`),c("P Value", figure_2_data$P))
forestplot(labeltext=tabletext,graph.pos = 2,mean = c(NA,figure_2_data$OR),lower = c(NA,figure_2_data$Low),upper = c(NA,figure_2_data$High),boxsize = 0.5,
            txt_gp=fpTxtGp(label=gpar(cex=1.25),
                         ticks=gpar(cex=1.1),
                         xlab=gpar(cex = 1.2),
                         title=gpar(cex = 1.2)),zero = 1,align = "l",
           is.summary = c(T,T,F,F,F,F,T,F,F,F,F,T,F,F,F,F,T,F,F,F,F),
           col = fpColors(box = c("darkblue","darkred")),
           fn.ci_norm = fn,
           colgap = unit(8,"mm"),
           graphwidth = unit(12,"cm")
           )
效果图

line_list_Insuf1=list()
for (i in 1:84) {
  exprs=paste0("line_list_Insuf1$`",i,"`=gpar(lwd=1, columns=1:5, col = '#99999922')")
  eval(parse(text=exprs))
}
line_list_Insuf1$`1`=gpar(lwd=2, columns=1:7, col = '#202020')
line_list_Insuf1$`2`=gpar(lwd=2, columns=1:7, col = '#202020')
# parse 将character转换为expression
# eval 执行 expression
# forestplot 函数里面再加上这句参数
hrzl_lines = line_list_Insuf1

以上就是R语言可视化开发forestplot根据分组设置不同颜色的详细内容,更多关于forestplot分组设置颜色的资料请关注编程网其它相关文章!
--结束END--
本文标题: R语言可视化开发forestplot根据分组设置不同颜色
本文链接: https://lsjlt.com/news/148573.html(转载时请注明来源链接)
有问题或投稿请发送至: 邮箱/279061341@qq.com QQ/279061341
2024-03-01
2024-03-01
2024-02-29
2024-02-29
2024-02-29
2024-02-29
2024-02-29
2024-02-29
2024-02-29
2024-02-29
回答
回答
回答
回答
回答
回答
回答
回答
回答
回答
0